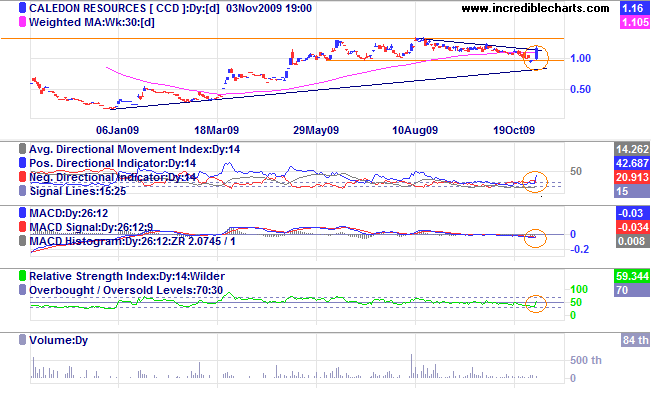
Here's a chart for anyone interested. Directional movement, moving average and RSI crossed, MACD crossing. Would be expecting to push through the short term resistance/downtrend later this week followed by some heavy volumes to break out through the long term resistance at $1.30ish (next week I'm thinking).
Add to My Watchlist
What is My Watchlist?


