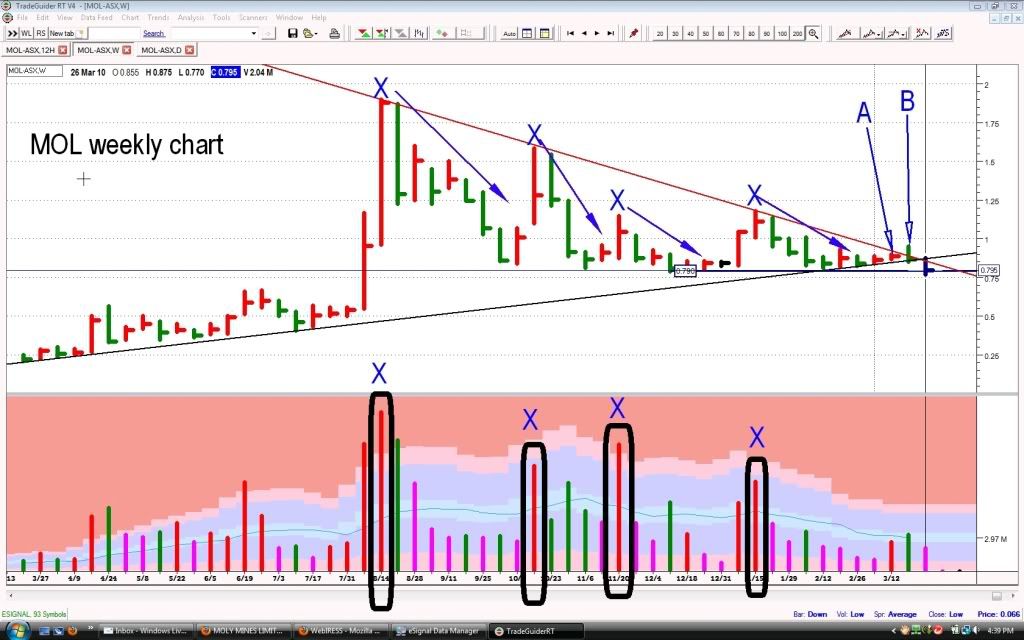
imo MOL's chart is not looking good, I'm not downramping at all just viewing what may be coming.
firstly MOL has broken a long uptrend line, it is sitting right on support of 79cents from early DEC09.
Three weeks ago, indicated as "A" on the chart, we have much more volume on that week compared to the previous, BUT it is very narrow - which indicates a form of capping by the professionals.
Two weeks ago, indicated by "B" on the chart we have much more volume with a bar with a higher tail indicating weakness, more hidden selling, and this last week is the weakness continuing to flow.
imo, unfortunately, I think MOL will break down and will not stop until we see a high volume down week just like the LAST week which tagged 79cents from DEC09, and it will be made up of traders selling because of MOL breaking and the professionals buying, of course I could be completely wrong, that being the case this post will self destruct.
imo MOL's chart is not looking good, I'm not downramping at all...
Add to My Watchlist
What is My Watchlist?


