Princess1
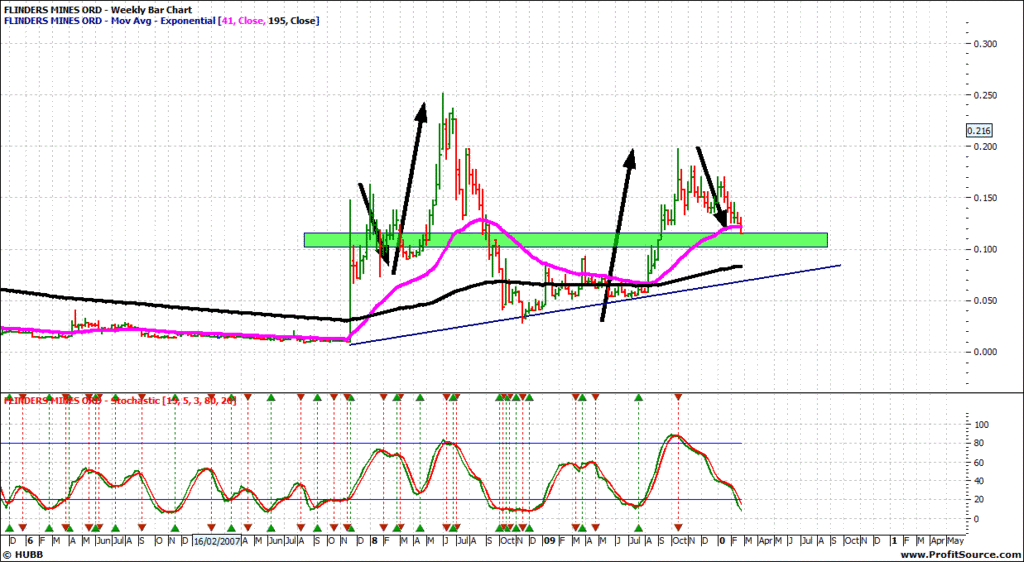
You asked for a chart on FMS, and below is a weekly chart with probably better looking at a larger timeframe in order to hopefully avoid some of the market volatility out there now.
2 Large repeating ranges up suggested it needed a breather and looking at the retrace ranges its possible that it could find support here in the green which is an area of support and resistance in the past.
EMA's price breaking the pink (long above pinky) is a concern and if much further I like to think 195EMA will hold it, and that's coming through at the diagonal support line.
As for buying, the weekly stochastics are becoming oversold, and if I was buying this I would go hunting when the stochastics cross up.
If the company has the goods it will stand the market test and be fruitful for you. The scarier you think the world is the scarier it will be.
Regards
Rob
- Forums
- ASX - By Stock
- RHK
- chart
chart
-
- There are more pages in this discussion • 3 more messages in this thread...
You’re viewing a single post only. To view the entire thread just sign in or Join Now (FREE)
Featured News
Add RHK (ASX) to my watchlist
 (20min delay) (20min delay)
|
|||||
|
Last
86.0¢ |
Change
0.060(7.50%) |
Mkt cap ! $171.8M | |||
| Open | High | Low | Value | Volume |
| 82.5¢ | 86.0¢ | 82.0¢ | $18.21K | 21.61K |
Buyers (Bids)
| No. | Vol. | Price($) |
|---|---|---|
| 2 | 4542 | 80.0¢ |
Sellers (Offers)
| Price($) | Vol. | No. |
|---|---|---|
| 87.0¢ | 4000 | 1 |
View Market Depth
| No. | Vol. | Price($) |
|---|---|---|
| 1 | 172 | 0.860 |
| 2 | 4542 | 0.800 |
| 1 | 2531 | 0.770 |
| 1 | 16200 | 0.760 |
| 2 | 5573 | 0.740 |
| Price($) | Vol. | No. |
|---|---|---|
| 0.870 | 4000 | 1 |
| 0.880 | 10355 | 1 |
| 0.890 | 2368 | 1 |
| 0.910 | 20000 | 1 |
| 0.980 | 10000 | 1 |
| Last trade - 16.10pm 18/07/2024 (20 minute delay) ? |
Featured News
| RHK (ASX) Chart |


