here's a thought. the 2 Andrews forks on the chart below seem to be validated by the touches of the sp on the centre lines. I think which fork TOL eventually follows may depend on where the market is heading. Note how the centre line of the descending sky blue fork is horribly close to the 195 day ema (dark blue line)...so that may add further weight to Robbbb's idea that the 195 may be tested from the underside.
One scenario I am thinking of is that an equalateral triangle may form through March between the blue fork centreline and the purple fork lower line.....but who really knows (he asks rhetorically).... That's just a little something to keep an eye on.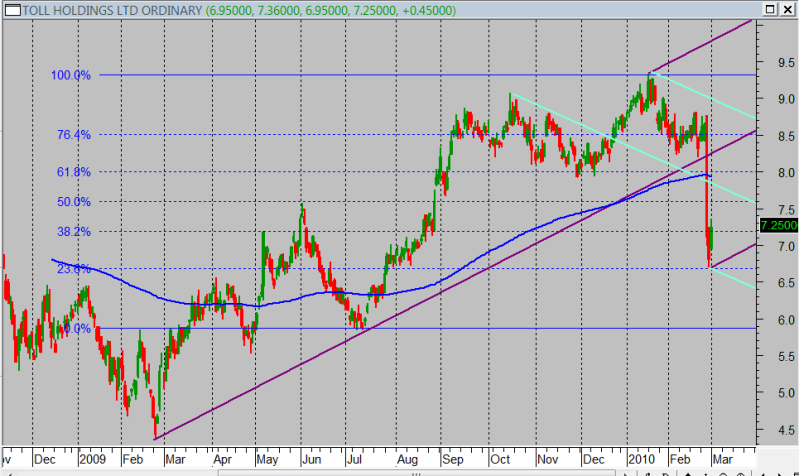
here's a thought. the 2 Andrews forks on the chart below seem to...


Add to My Watchlist
What is My Watchlist?