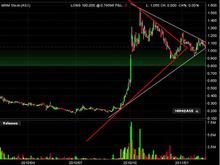
Thanks wantedman. Tu. So many shapes there which makes the chart both interesting and challenging. If we pull back the triangle lines a tad, we can see that one attempted break has already occurred:
The more the chart bounces around the lines of the triangle the stronger the triangle formation.
Like the flag interpretation twincreeks. Don't know why I comment on charts though because I rarely use them to trade/invest MHM lol...Think the downtrend may continue for a while until further news ensues or a timeline offered by the company in any one of its announcements is reached. Wouldn't sell if the bottom trend line is broken. The MHM chart reacts to news items and anticipation of timelines. In particular the most immediate upwave to 1.16 odd was due to pending silica announcement plus NMP but there wasn't enough gas to take it further.
MHM Price at posting:
$1.03 Sentiment: LT Buy Disclosure: Held
A personalised tool to help users track selected stocks. Delivering real-time notifications on price updates, announcements, and performance stats on each to help make informed investment decisions.


 (20min delay)