Needed a more definitive chart after yesterdays rushed job.
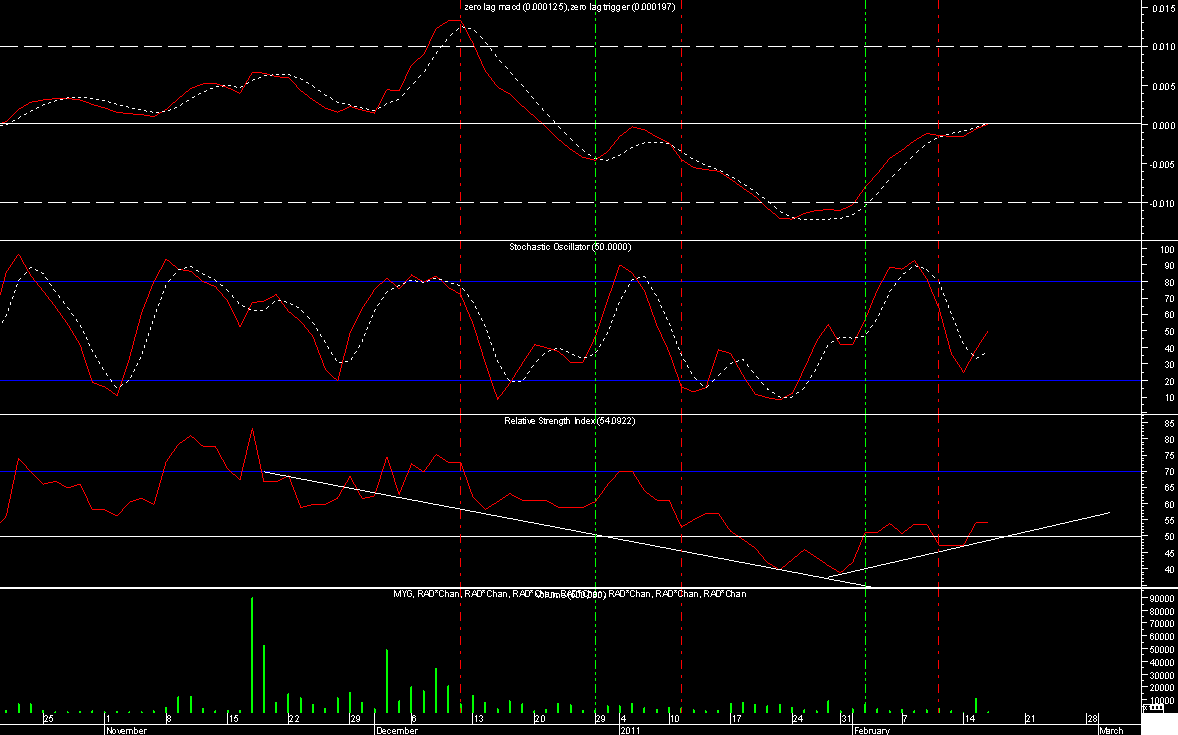
This one shows a number of considerations taken for the buy/sell and stoploss calcs..
The idea is to read the vertical red and green lines as they intersect price and oscillators.Rule of thumb since the last major spike in december is to combine oscillator timing with a 15 period exponential moving average (its the white MA currently at .145)the 30 is in yellow..I have back tested several volatility based stoplosses and found the current price tics are just to volatile to be $ % efficient...Current trading channel shows the .15 resistance backed up by the on market sell feeds at this price...Its basically in an accumulation atm with a reasonable stoploss of .135 imo.Above 15 close will trigger a 2 week breakout, above .16 should indicate/confirm a major bullish channel and trend change.
trading back to 145 atm.15 resistance is persistent..
(and Im certainly not going to mention the gap at 14...lol)
looking at the major trendline convergence points (a symmetrical triangle of sorts) this horizontal accumulation may take till early March which may also coincide with more FA results..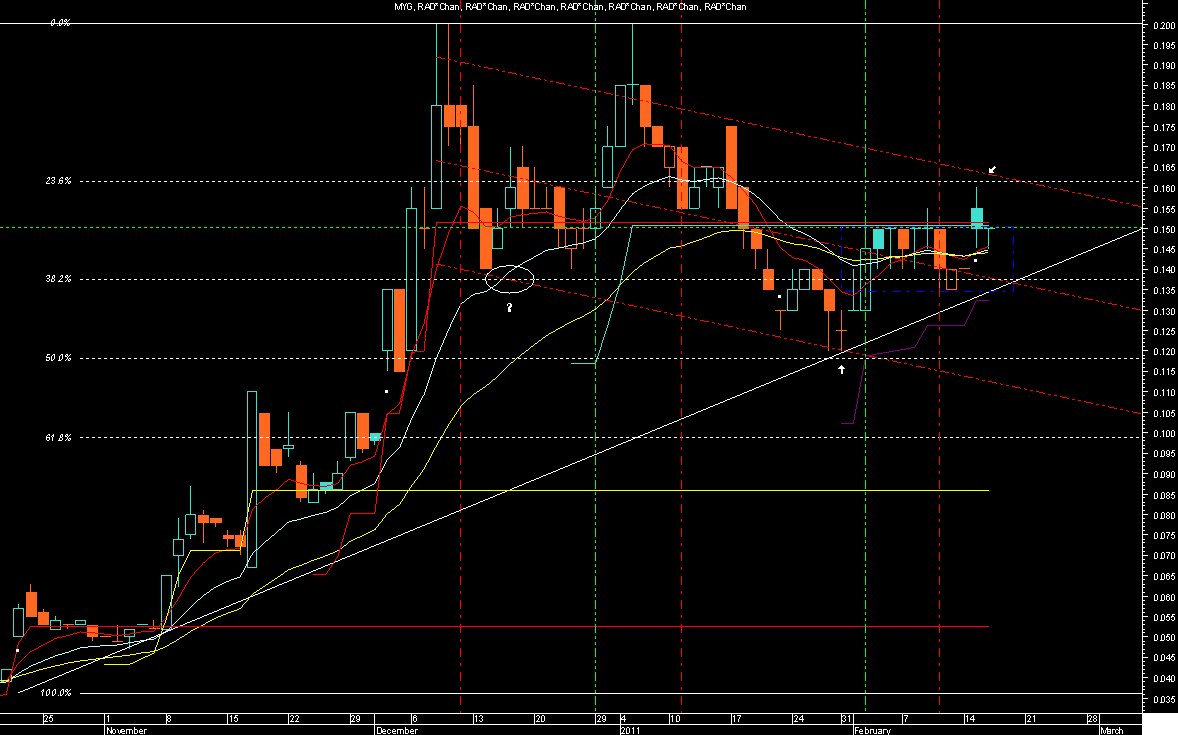
heres an extract from BuySellSignals Via Bell Securities
Sorry its messy and repeats a bit..
Short-Term Rating (Technical): 5 out of 5
Significantly its price of 15.0c is at a premium of 88% to its 200-day moving average price of 7.98c. Its 52-
week range has been 20.0c to 2.60c; it is trading at a discount of 25 % to its 52-week high and a premium of
476.9 % to its 52-week low. $1,000 invested exactly one year ago is now worth $4,412 of which $3,412 is a
capital gain.
Recommended stop loss: 13.875c
Bullish Signals:
In the Australian market of 1,418 stocks and 76 units traded today, the stock has a 6-month relative
strength of 97 which means it is beating 97% of the market.
A price rise combined with a high relative strength is a bullish signal.
The price to 50-day EMAP ratio is 1.1, a bullish indicator. In the past 50 days this ratio has exceeded 1.1
35 times suggesting further upside.
The 50-day MAP of 15.21c is higher than the 200-day MAP of 7.98c.
In the last three months the stock has hit a new 52-week high eight times, pointing to a significant
uptrend.
PRICE VOLUME DYNAMICS
Volatility
The stock traded between an intraday low of 14.50c and eighteen-day high of 16.0c. The price range has
expanded in the last two days (from 0.50c two days ago to 2.0c today) which, accompanied by a price rise, is
a bullish signal. Today its volatility of 10.3% was 8.1 times its average volatility of 1.3%. A price rise on high
volatility is a bullish signal.
Moving average price (MAP) [with equal weightage to prices at close]
The price to 200-day MAP ratio is 1.88, a bullish indicator. In the past 200 days this ratio has exceeded 1.88
54 times suggesting further upside. The 50-day MAP of 15.21c is higher than the 200-day MAP of 7.98c,
another bullish indicator.
Relativities
Today its percentile rank in the Australian market was 94. In the Australian market of 1,418 stocks and 76
units traded today, the stock has a 6-month relative strength of 97 which means it is outperforming 97% of
the market. A price rise combined with a high relative strength is a bullish signal
chart, page-2


Add MYG (ASX) to my watchlist
 (20min delay) (20min delay)
|
|||||
|
Last
74.3¢ |
Change
-0.010(1.33%) |
Mkt cap ! $67.91M | |||
| Open | High | Low | Value | Volume |
| 75.0¢ | 75.0¢ | 74.0¢ | $20.38K | 27.22K |
Buyers (Bids)
| No. | Vol. | Price($) |
|---|---|---|
| 2 | 15281 | 73.5¢ |
Sellers (Offers)
| Price($) | Vol. | No. |
|---|---|---|
| 75.0¢ | 55 | 1 |
View Market Depth
| Last trade - 15.27pm 07/10/2024 (20 minute delay) ? |
| MYG (ASX) Chart |