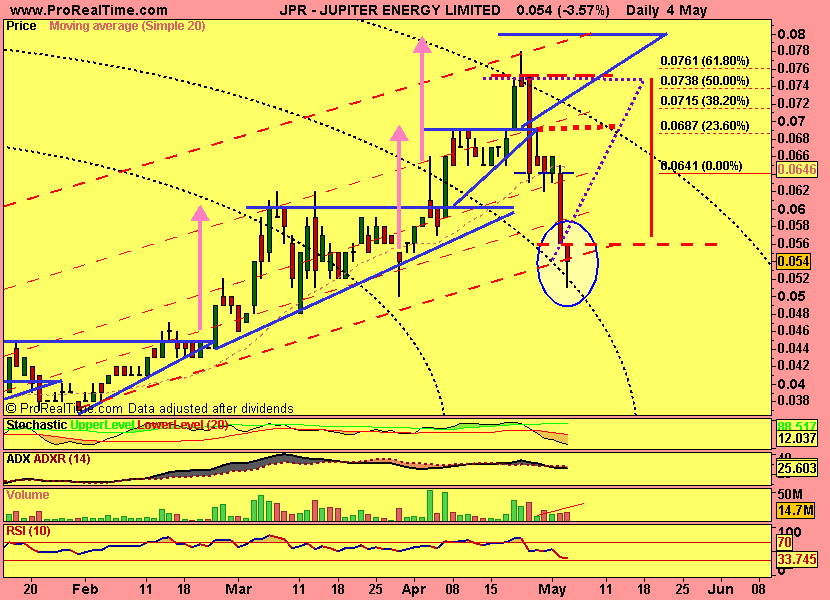
what i like most about todays chart is this increase in volume and the last candle, a hammer. would prefer the wick twice as long as the candles real body but i'll take what i get. this gives us a Bullish Hammer Pattern. indicative of a reversal. it's reliability is low but add to it that it rested on that trending line and the wick was in the arc channel raises it to a mid reliability level.
on the basis of the above i increased my holding today. i'll watch the open closely tomorrow if it looks like breaking that support i'll exit and take the loss. if not i'll ride the wave and pick an exit point later.
- Forums
- ASX - By Stock
- JPR
- chart
JPR
jupiter energy limited
Add to My Watchlist
0.00%
!
2.9¢

chart
Featured News
Add to My Watchlist
What is My Watchlist?
A personalised tool to help users track selected stocks. Delivering real-time notifications on price updates, announcements, and performance stats on each to help make informed investment decisions.
|
|||||
Last
2.9¢ |
Change
0.000(0.00%) |
Mkt cap ! $37.14M |
Open | High | Low | Value | Volume |
2.9¢ | 2.9¢ | 2.9¢ | $4.35K | 150K |
Buyers (Bids)
No. | Vol. | Price($) |
---|---|---|
2 | 100170 | 2.9¢ |
Sellers (Offers)
Price($) | Vol. | No. |
---|---|---|
3.3¢ | 200000 | 1 |
View Market Depth
No. | Vol. | Price($) |
---|---|---|
2 | 100170 | 0.029 |
1 | 300000 | 0.017 |
2 | 64889 | 0.016 |
1 | 10000 | 0.010 |
0 | 0 | 0.000 |
Price($) | Vol. | No. |
---|---|---|
0.033 | 200000 | 1 |
0.035 | 3134 | 1 |
0.045 | 70000 | 1 |
0.050 | 170000 | 1 |
0.110 | 12400 | 1 |
Last trade - 11.33am 23/07/2025 (20 minute delay) ? |
Featured News
JPR (ASX) Chart |