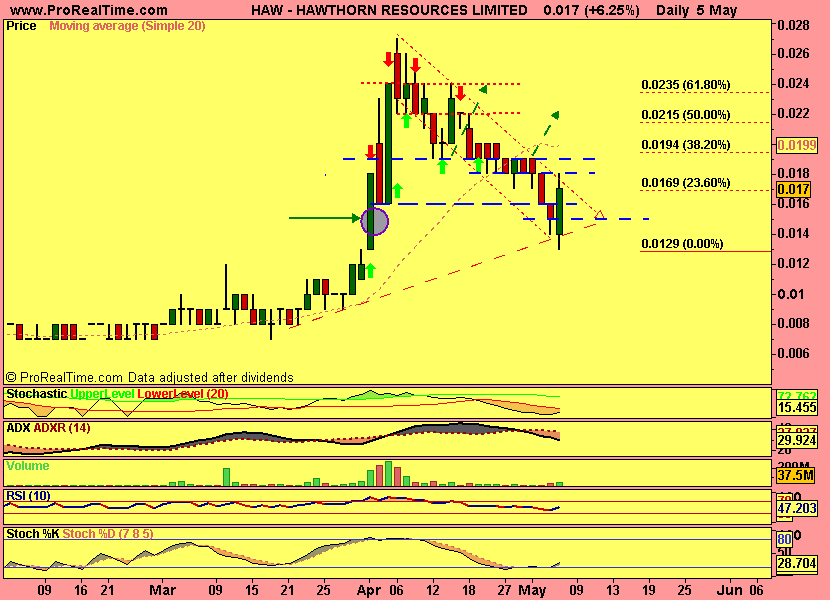
well, the charts never lie. and the two support lines that the last candle was sitting on proved too strong and a small reversal happened today. this is why FA should only ever play a small part in a traders arsenal. it's fine for the investor as they need to know what's happening next year. but for the trader we need to know last night what's going to happen today. and only the charts can provide that level of accuracy.
last candle nothing great. upper and lower wicks showing the bulls and the bears having a fair go at trying to set the price. what i like is the Bullish Engulfing Pattern that the last 2 candles have formed. this bodes well for a reversal of the down trend we have been in.
nice call by the person that said 17 (23.60% fibb line) would act as resistance.
chart, page-45


Add HAW (ASX) to my watchlist
 (20min delay) (20min delay)
|
|||||
|
Last
5.8¢ |
Change
0.000(0.00%) |
Mkt cap ! $19.43M | |||
| Open | High | Low | Value | Volume |
| 0.0¢ | 0.0¢ | 0.0¢ | $0 | 0 |
Buyers (Bids)
| No. | Vol. | Price($) |
|---|---|---|
| 1 | 25862 | 5.8¢ |
Sellers (Offers)
| Price($) | Vol. | No. |
|---|---|---|
| 6.9¢ | 9001 | 1 |
View Market Depth
| Last trade - 16.12pm 16/10/2024 (20 minute delay) ? |
| HAW (ASX) Chart |
Day chart unavailable