OK, so here's a new chart.
Few things to note IMO.
First, the long-term trendline that started back in March of this year looks to now be broken. It is the most significant trend line on this chart.
There has also been significant accumulation in the 5.5-6c range (note that that indicator is trading volume so does not include placements i.e. the CR). The 6c capper been doing his job here???
Stochs are on the uptick and are widening.
MACD also continues to increase and widen.
Bollies are also quite tight.
Now we just need to see some volume.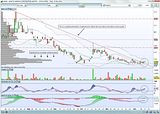


Add to My Watchlist
What is My Watchlist?