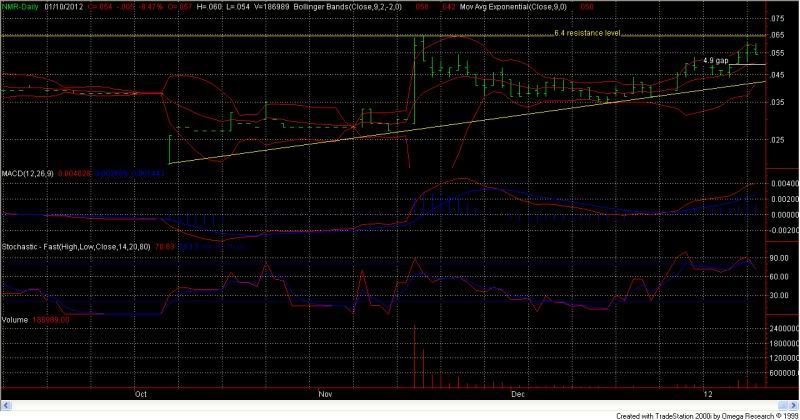
Negatives:
Bollinger bands overbought.
The price is below the linear regression value.
Momentum indicator is overbought. (0.01)
Rate of Change (35.00) indicates an overbought market condition
RSI is somewhat overbought at 62.97.
The swing index has crossed under zero, issuing a short term bearish signal..
TRIX (72.14) indicates an overbought market.
Average True Range just reached an 18 bar high, offering some evidence that a top is forming here..
Stochastic: The K line crossed below the D line indicating a sell signal.
The volume oscillator suggests a stall.
Positives:
Parabolic is in bullish territory.
DMI is in bullish territory.
The LT trend based on a 45 bar MA is up. The ST trend based on a 9 bar MA is up. MACD is in bullish territory.
Volume Rate of Change is positive.
Today’s activity has formed an inside-day reversal pattern on the daily chart. The share price may re-trace to the mid/high 4’s in the short term IMO. A great buying opportunity..
The nearest resistance major resistance points appear to be at 6.0 and 6.4.
- Forums
- ASX - By Stock
- NMR
- chart
chart, page-49
-
- There are more pages in this discussion • 105 more messages in this thread...
You’re viewing a single post only. To view the entire thread just sign in or Join Now (FREE)
Featured News
Add NMR (ASX) to my watchlist
 (20min delay) (20min delay)
|
|||||
|
Last
2.1¢ |
Change
0.000(0.00%) |
Mkt cap ! $5.508M | |||
| Open | High | Low | Value | Volume |
| 2.2¢ | 2.2¢ | 2.1¢ | $761 | 34.62K |
Buyers (Bids)
| No. | Vol. | Price($) |
|---|---|---|
| 1 | 140922 | 2.1¢ |
Sellers (Offers)
| Price($) | Vol. | No. |
|---|---|---|
| 2.2¢ | 13924 | 1 |
View Market Depth
| No. | Vol. | Price($) |
|---|---|---|
| 1 | 140922 | 0.021 |
| 1 | 150000 | 0.020 |
| 2 | 102787 | 0.018 |
| 3 | 1450822 | 0.015 |
| 1 | 20000 | 0.012 |
| Price($) | Vol. | No. |
|---|---|---|
| 0.022 | 13924 | 1 |
| 0.026 | 75000 | 1 |
| 0.027 | 10000 | 1 |
| 0.032 | 100000 | 1 |
| 0.034 | 10000 | 1 |
| Last trade - 14.42pm 29/08/2024 (20 minute delay) ? |
Featured News
| NMR (ASX) Chart |


