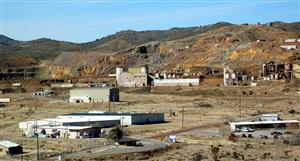
EWC energy world corporation ltd

Chart

  1. 6,340 Posts.
    lightbulb Created with Sketch. 250
    Daily chart of ECW

    We have a pretty gorgeous ascending triangle with higher lows and a resistance level at ~9.7c (Green lines)
    This is the first time in 22 months that we've seen this stock close above the 200 moving average (Yellow line), and managed to stay above it for a few days now.
    Long term resistance from over 2 years ago (Light-blue line). If this gets broken on volume, we'll be on a nice swing to the upside.

    Momentum is shifting. It's slow, but waiting for confirmation.

    https://hotcopper.com.au/data/attachments/1800/1800844-dd0e03e65a30c966f2f8e62e3f60d357.jpg

    Zoomed out view of the daily chart to show the long term resistance level.

    https://hotcopper.com.au/data/attachments/1800/1800842-021b21f8bd68b7cd58c0eb21716dcecf.jpg

 
Add to My Watchlist
What is My Watchlist?
A personalised tool to help users track selected stocks. Delivering real-time notifications on price updates, announcements, and performance stats on each to help make informed investment decisions.
(20min delay)
Last
6.1¢
Change
0.002(3.39%)
Mkt cap ! $187.8M
Open High Low Value Volume
6.0¢ 6.5¢ 6.0¢ $103.8K 1.659M

Buyers (Bids)

No. Vol. Price($)
1 83285 6.1¢
 

Sellers (Offers)

Price($) Vol. No.
6.5¢ 167264 3
View Market Depth
Last trade - 16.10pm 22/08/2025 (20 minute delay) ?
EWC (ASX) Chart
arrow-down-2 Created with Sketch. arrow-down-2 Created with Sketch.