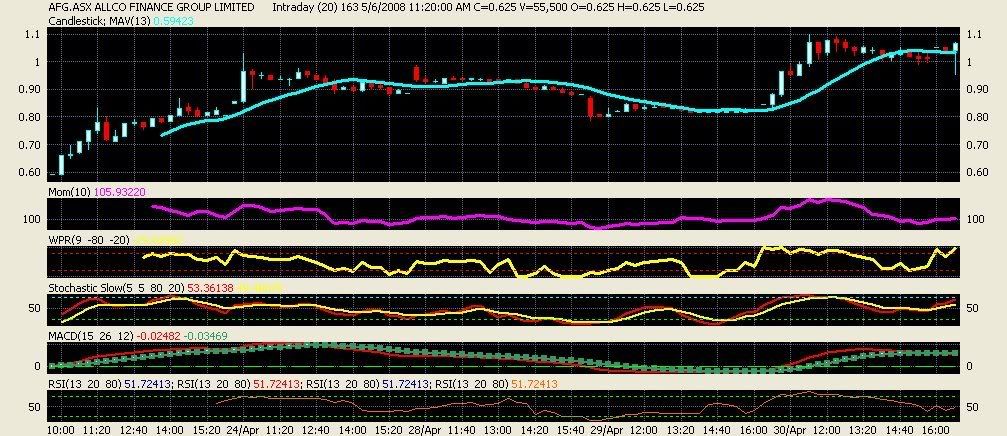
Hi All,For those that may be interested this is a copy of 10 dayx20 chart for AFG.
Was buy on 23/04 as macd crossed from 0% @60cents.
Was sell on 24/04 as macd crossed from 100% @ 90cents.
Was buy on 29/04 as Slow Stochastic & Williams% moved before macd after it flat lined @0%.Buy price was 82cents.
Was sell on 30/04-1/05 as indicators had crossed from 100%.Sell price $1 plus.
Was buy yesterday after lunch as indicators were trending up & macd had flat lined @ 0%.Buy price 54-58 cents.
As always with a share positive or negative announcements can alter things .
All in all on a 10 day cycle there is ample opportunity to trade part of your holding to pay the weekly bills .
Cheers .
img src="http://i214.photobucket.com/albums/cc42/kelpie000/AFG2.jpg">
chart


Add AFG (ASX) to my watchlist
 (20min delay) (20min delay)
|
|||||
|
Last
$1.41 |
Change
-0.015(1.05%) |
Mkt cap ! $381.7M | |||
| Open | High | Low | Value | Volume |
| $1.43 | $1.43 | $1.41 | $343.4K | 242.8K |
Buyers (Bids)
| No. | Vol. | Price($) |
|---|---|---|
| 3 | 18682 | $1.41 |
Sellers (Offers)
| Price($) | Vol. | No. |
|---|---|---|
| $1.42 | 609 | 1 |
View Market Depth
| Last trade - 16.10pm 21/06/2024 (20 minute delay) ? |
| AFG (ASX) Chart |