heres the old chart template a few folk contributed to..
while we were always stuck in the dominant down trend..
All of the Triangular patterns did hold up as support and resistance levels as did the horizontal resistance levels..
these are still accurate in terms of picking the next long breakouts..
It shows its sometimes wiser for longer term traders to sacrifice 20% plus off the bottom recovery to confirm a trend change..IE the green line is the 30 period EMA its at 105 .Its a safe entry but you will miss a 25% gain by waiting..oops thats 30% .....Daytrades a different kettle with a close above 85 on volume being an entry imo..
Critical opinion very welcome...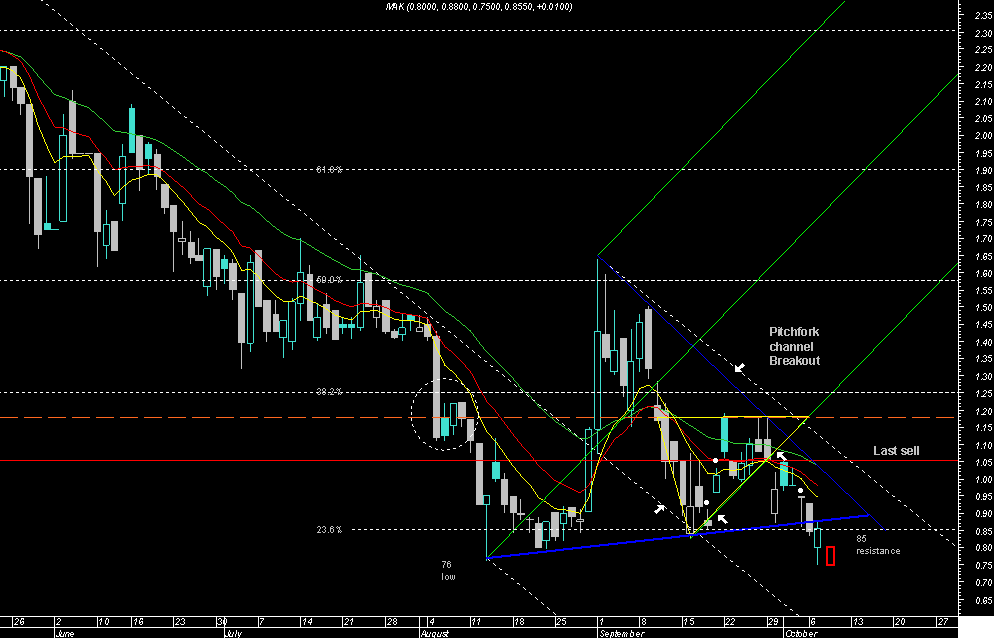
heres the old chart template a few folk contributed to..while we...


Add AEV (ASX) to my watchlist
 (20min delay) (20min delay)
|
|||||
|
Last
0.4¢ |
Change
-0.001(20.0%) |
Mkt cap ! $9.396M | |||
| Open | High | Low | Value | Volume |
| 0.5¢ | 0.5¢ | 0.4¢ | $18.4K | 4.395M |
Buyers (Bids)
| No. | Vol. | Price($) |
|---|---|---|
| 8 | 2724908 | 0.4¢ |
Sellers (Offers)
| Price($) | Vol. | No. |
|---|---|---|
| 0.5¢ | 1130000 | 2 |
View Market Depth
| Last trade - 15.40pm 03/07/2024 (20 minute delay) ? |
| AEV (ASX) Chart |