the closing candle was white
as such it remains bullish
however the upper shadow of 3.5c remains a rejection of a higher price..perhaps profit taking with some substantial sell volumes amidst the flippin Bot algorythms .
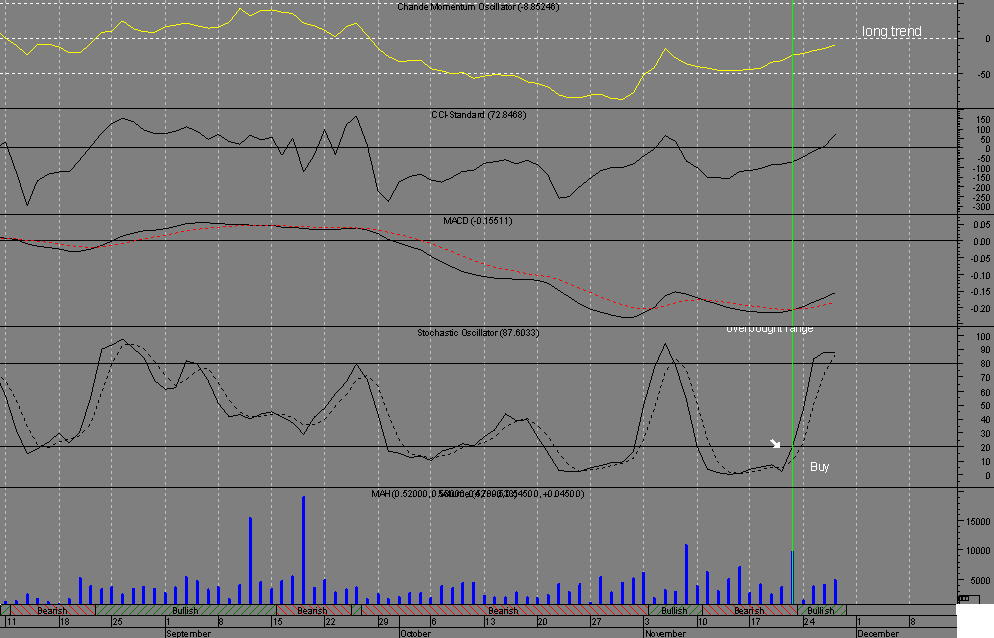
the chart shows numerous bullish oscillators and while the stochastics are in an overbought range, a check for the stochastics is by checking the prevailing trend by using the Chande Momentum Oscillator ,it is still trending long .
imo the trailing stop may be tested (refer thread)due to the long upper shadow however it will not retrace below the stop.
Be handy if all our software had a Dow sentiment factor.
Im sure many use the Dows relative strength as a TA variable factor...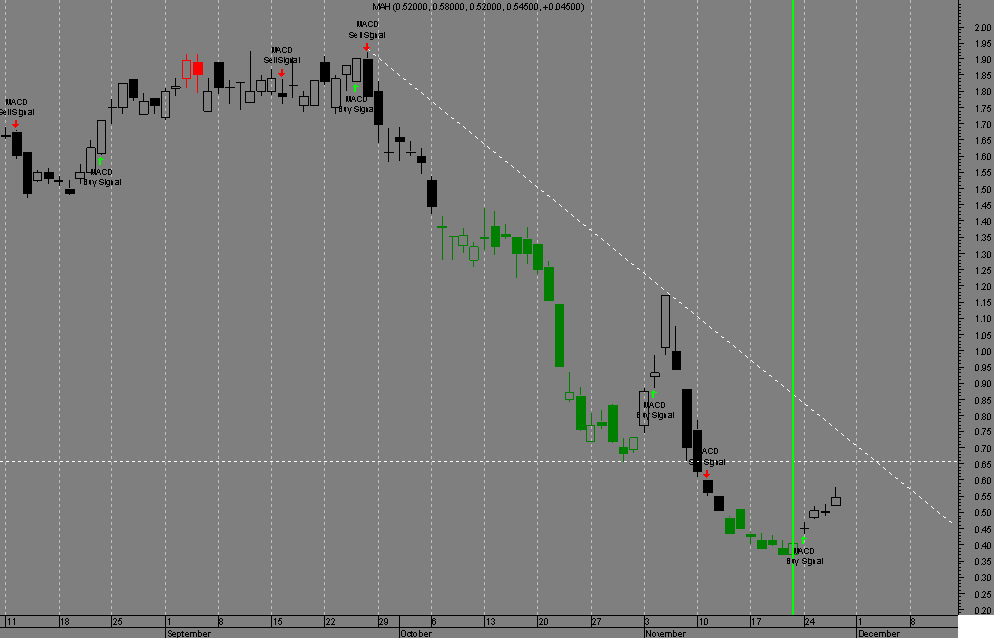
chart, page-23


Add MAH (ASX) to my watchlist
 (20min delay) (20min delay)
|
|||||
|
Last
32.0¢ |
Change
-0.005(1.54%) |
Mkt cap ! $689.5M | |||
| Open | High | Low | Value | Volume |
| 32.5¢ | 33.5¢ | 32.0¢ | $425.7K | 1.305M |
Buyers (Bids)
| No. | Vol. | Price($) |
|---|---|---|
| 1 | 16993 | 32.0¢ |
Sellers (Offers)
| Price($) | Vol. | No. |
|---|---|---|
| 33.0¢ | 118575 | 4 |
View Market Depth
| Last trade - 16.10pm 01/10/2024 (20 minute delay) ? |
| MAH (ASX) Chart |