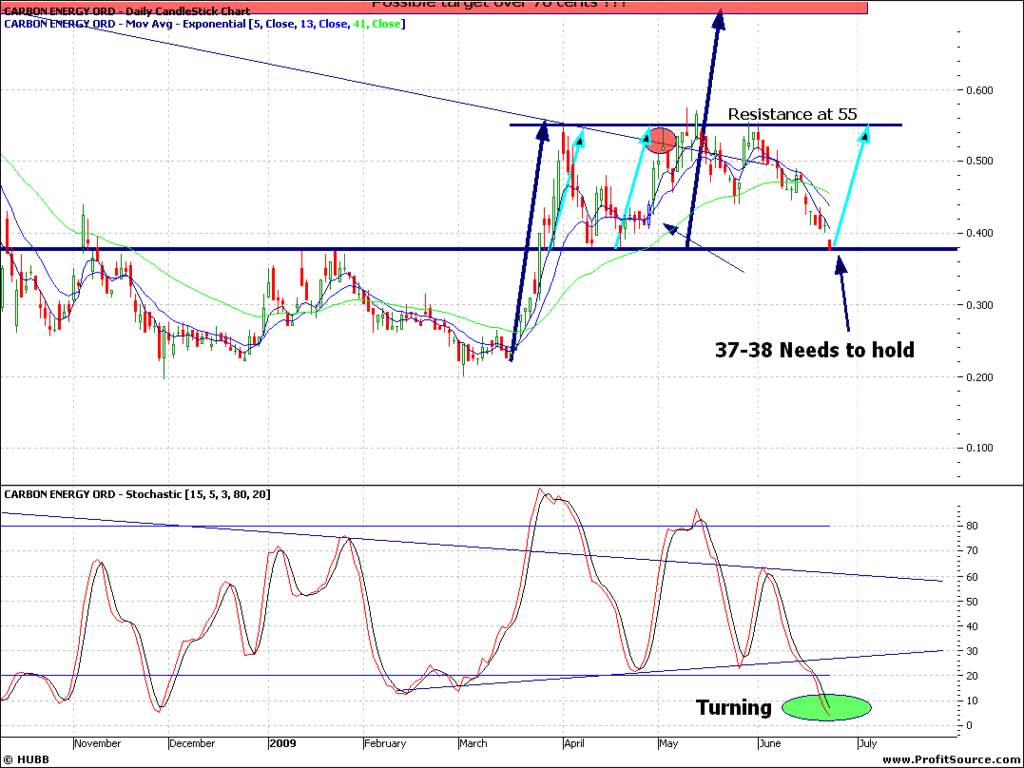
Noticed CNX when flicking through old charts just then.
Was almost tooo obvious that the low would be 37-38 cents. You can see so many bounces using that line as support AND resistance. That said, it does need to hold. The stochastics are looking good now though, a green day today should see them cross now.
Could see it bounce back to 55 cents, however, weekly chart does not support this, so may see a smaller bounce.
Add to My Watchlist
What is My Watchlist?


