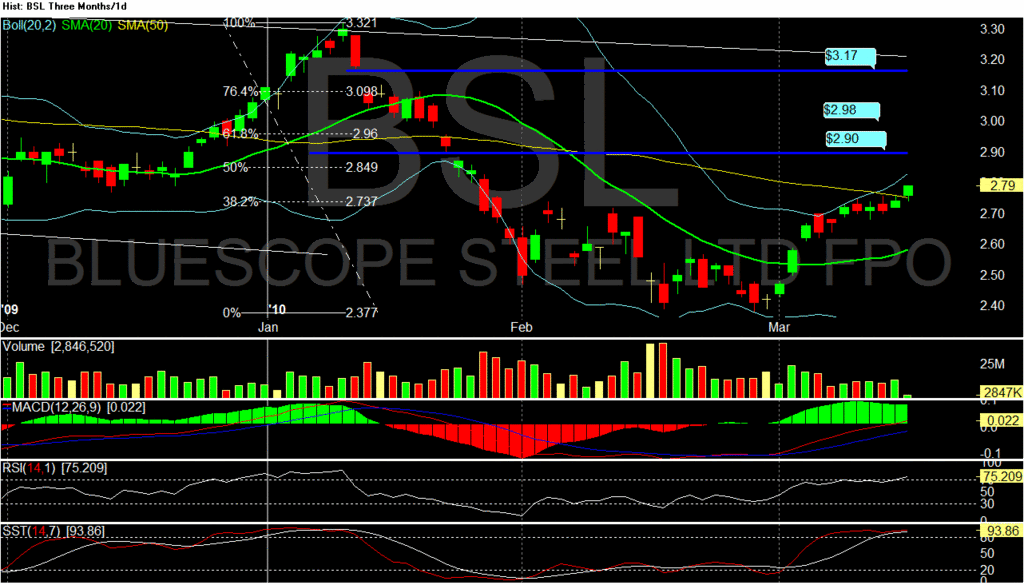
BSL has risen above the 50 day moving average (yellow line), and while the daily chart is overbought, the weekly shows much upside to come.
There are lots of unfilled gaps to fill as per chart, and the weekly says these can easily be taken out.
May need a small pullback first...or will stay overbought for some time as this happens.
- Forums
- ASX - By Stock
- BSL
- charting upside gaps to fill
BSL
bluescope steel limited
Add to My Watchlist
0.76%
 !
$22.43
charting upside gaps to fill
Featured News
Add to My Watchlist
What is My Watchlist?
A personalised tool to help users track selected stocks. Delivering real-time notifications on price updates, announcements, and performance stats on each to help make informed investment decisions.
 (20min delay) (20min delay)
|
|||||
|
Last
$22.43 |
Change
0.170(0.76%) |
Mkt cap ! $9.838B | |||
| Open | High | Low | Value | Volume |
| $22.47 | $22.64 | $22.18 | $66.53M | 2.955M |
Buyers (Bids)
| No. | Vol. | Price($) |
|---|---|---|
| 1 | 9599 | $22.42 |
Sellers (Offers)
| Price($) | Vol. | No. |
|---|---|---|
| $22.44 | 30000 | 10 |
View Market Depth
| No. | Vol. | Price($) |
|---|---|---|
| 2 | 130 | 22.150 |
| 1 | 1400 | 22.140 |
| 1 | 45 | 22.120 |
| 1 | 340 | 22.100 |
| 3 | 23045 | 22.000 |
| Price($) | Vol. | No. |
|---|---|---|
| 22.540 | 1000 | 1 |
| 22.650 | 1000 | 1 |
| 22.660 | 1000 | 1 |
| 22.700 | 450 | 1 |
| 22.710 | 686 | 1 |
| Last trade - 16.11pm 19/09/2025 (20 minute delay) ? |
Featured News
| BSL (ASX) Chart |


