Max,
I hear what you are saying and agree.
I would love to see one if you can come up with it, it's a licence to print money..imo
So I'll go to work on it and get back to you.. no doubt you will get back to me first...lol your like that and thats what I like about you...
At this point with this stock we need to go back to basic's
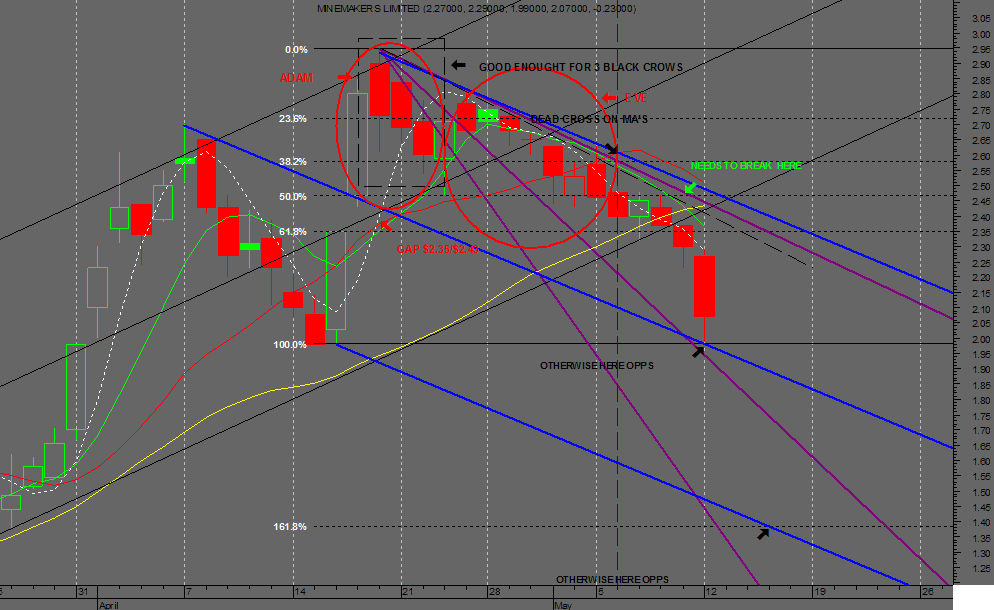
and look for Candle Patterns,Fibs ect..for it was a Candle Top 3 Crows that made me call a top.
I've since then looked at Island Clusters ect but there is no gap down so its not valid and carn't be measured..imo
The next best is a Adam and Eve Top carn't be measured from what I read .buggger.
This Top has had every Triangle within it and I feel for for Some who bought in the middle of it on the 28/04/08 most traders would not have picked that but they would have had a Stop Loss.
So IMO THE INDICATORS we are using are GOOD they just need to TURN UP.
Untill then we are looking for A Morning Star Candle in the morning which is on the cards.
Or a Bullish Engulfing Pattern
And have faith in the 100% fib and the Andrews Midline with tight stops joining the BOS Club..lol
Or there is the old rule of thumb 3 days Up is a bounce anything elese is gambling...or a dead cat bounce..It's now just a trade till it breaks the downtrend on volume..imo.
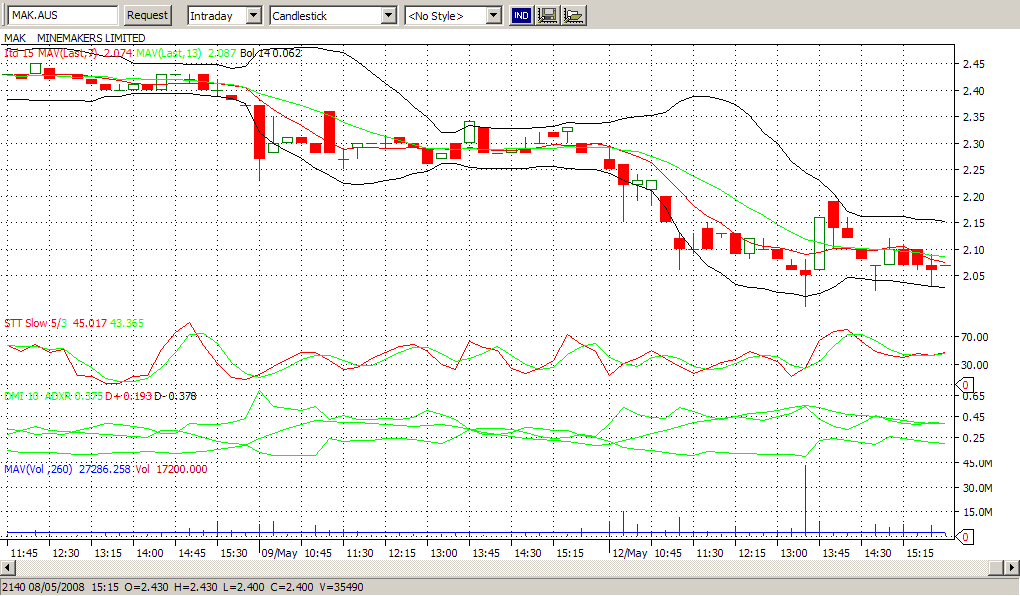
Here is the intraday day 15 min depending on open it's one or the other ..imo
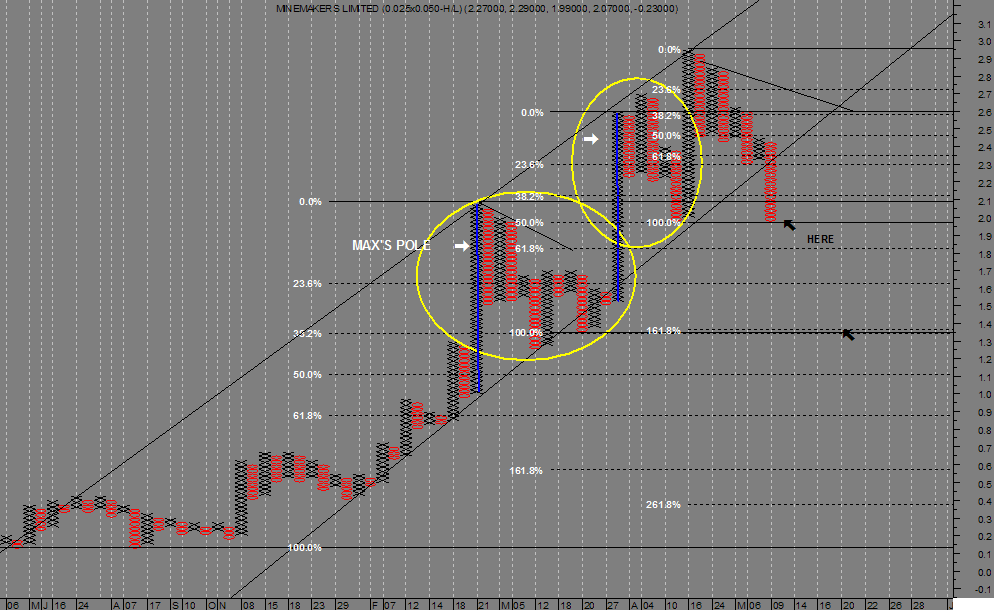
Or the P&F surport..?
Cheers Pete
PPS LOOK AT THE VOLUMES MORE TO COME IMO.
Plus 3 Crows on the weekly and needs to catch the 14 day MA...imo.
Stock charts print many unique topping formations. Some classics, such as the Descending Triangle, can be understood and traded with very little effort. But the emotional crowd also generates many undependable patterns as greed slowly evolves into mindless fear. Complex Rising Wedges will defy a technician's best effort at prediction while the odd Diamond pattern burns trading capital swinging randomly back and forth.
Skilled traders avoid these fruitless positions and only seek profit where the odds strongly favor their play. They first locate a common feature found in most topping reversals: price draws at least one lower high within the broad congestion before violating a major uptrend. This common double top mechanism becomes the focus for their trade entry. From this well-marked signpost, they follow price to a natural breaking point and enter when violated.
Do you recall the Adam & Eve Bottom, featured earlier in this column? This unique formation consists of a spiking first bottom, followed by a rounded second one. Flip the pattern over and you'll find a highly predictive structure for trading these topping reversals.
This simple Adam & Eve Top provides traders with frequent high profit short sales opportunities. Note this classic pattern in Quantum's chart. Price never drew a third high before entering a significant bear market. Successful A&E short sales can be entered on the first violation of the reaction low, regardless of an underlying trend. However, use tight stops to avoid "turtle reversals". These occur when sharp short covering rallies suddenly erupt right after the gunning of stops below a violation point.
Each uptrend generates positive sentiment that must be overcome through the topping structure. A&E tops represent an efficient bar structure to accomplish this task. The violent reversal of Adam first awakens fear. Then the slow dome of Eve absorbs the remaining bull impulse while dissipating volatility needed to resume a rally. As the dome completes, price moves swiftly to lower levels without substantial resistance.
Observant technicians will recognize the mechanics of Descending Triangles and Adam & Eve formations in more complex reversals. The vast majority of tops contain some characteristics of these familiar patterns. Crowd enthusiasm must be eliminated for a decline to proceed. Through the repeated failure of price to achieve new highs, buying interest eventually recedes. Then the market can finally drop from its own weight.
Quantum's 1997 multi-year high breaks down in a dramatic Adam and Eve Top. Look for both volume and volatility readings to decline gradually through the formation of the second rounded high. Most times, this "Eve" consumes more price bars than the "Adam" that precedes it.
- Forums
- ASX - By Stock
- AEV
- chartists only please
chartists only please, page-3
-
- There are more pages in this discussion • 80 more messages in this thread...
You’re viewing a single post only. To view the entire thread just sign in or Join Now (FREE)
Featured News
Add AEV (ASX) to my watchlist
 (20min delay) (20min delay)
|
|||||
|
Last
0.5¢ |
Change
0.000(0.00%) |
Mkt cap ! $11.74M | |||
| Open | High | Low | Value | Volume |
| 0.6¢ | 0.6¢ | 0.5¢ | $484 | 88.54K |
Buyers (Bids)
| No. | Vol. | Price($) |
|---|---|---|
| 7 | 2947616 | 0.5¢ |
Sellers (Offers)
| Price($) | Vol. | No. |
|---|---|---|
| 0.6¢ | 10091525 | 13 |
View Market Depth
| No. | Vol. | Price($) |
|---|---|---|
| 7 | 2947616 | 0.005 |
| 14 | 15867776 | 0.004 |
| 11 | 6740003 | 0.003 |
| 4 | 3175000 | 0.002 |
| 7 | 10749950 | 0.001 |
| Price($) | Vol. | No. |
|---|---|---|
| 0.006 | 10091525 | 13 |
| 0.007 | 3887938 | 6 |
| 0.008 | 4852760 | 7 |
| 0.009 | 351000 | 1 |
| 0.010 | 1151252 | 3 |
| Last trade - 16.10pm 12/07/2024 (20 minute delay) ? |
Featured News
| AEV (ASX) Chart |


