Ivan
your post is confusing
"I realise most people think charting is a load of BS."
perhaps you are a learner but dont be an apologist..
TA is gaining strength the survivors in this current downturn are those using capital preservation methods of stoplosses in their trades...
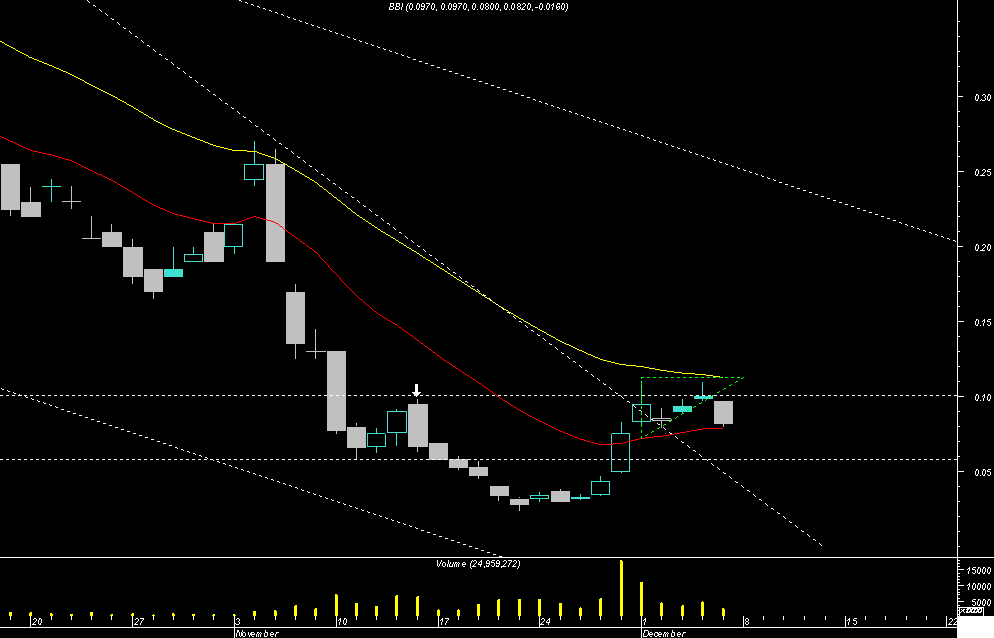
Your rising wedge observation had two problems
It was formed over to short a period and had two overhead (tweezer top) candle rejections as its high points.
Untill a new major long trend is clearly defined these patterns have far less chance of completion.
Yes charting is very hard in this market with everything following US leads...it means a wider channel range of stock moves is expected and a larger longer backtesting period on all our TA oscillators is necesarry (smoothing aberrations)
EG in a bullish market a 30 period Moving average was considered a conservative safe limit trigger to enter trades.
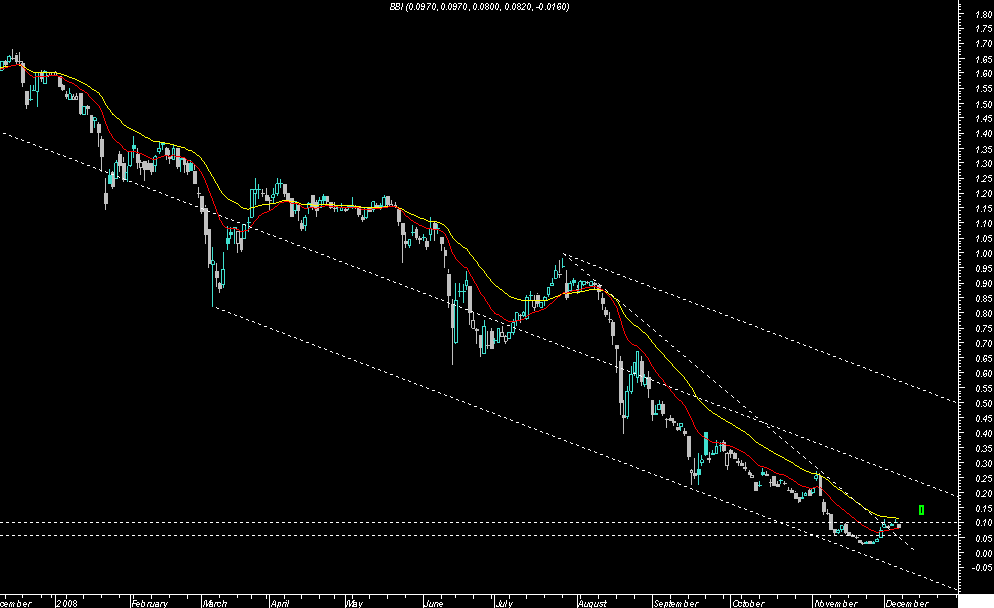
In this market Its an essential limit imo...Its the yellow ma on the bottom charts
here is your ascending wedge in its major trend perspective