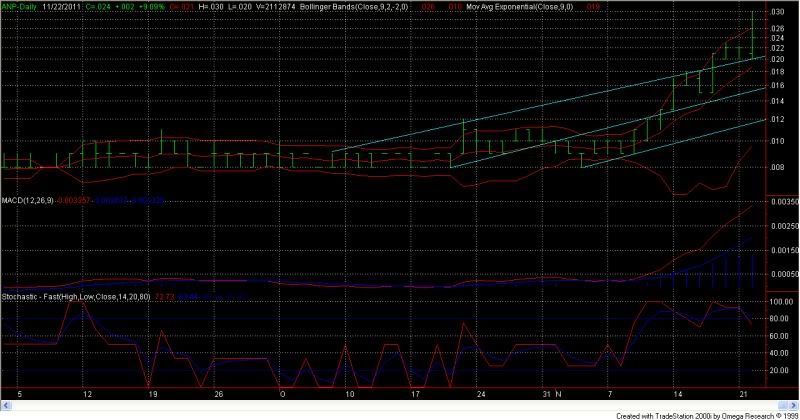
Today's chart..
RSI issued a bearish signal at 83.15.
Stochastic issued a sell signal, K line crossed below the D line. But still not putting much weight on it because it occurred previously then bounced back. (works best in bear markets)
Although showing some weakening in the uptrend, the parabolic is still long and in bullish territory.
Rate of change is overbought at 166.67 but in bullish territory, more highs are possible.
Volatility is in an uptrend based on a 9 bar MA.
Volume rate of change looks bullish.
MACD is in bullish territory, and suggests more new highs.
ADX recons it’s a healthy market and for the uptrend to continue.
DMI suggests more bullish pressure..
I don’t favor the look of today’s top-heavy bar, but at least it closed above the recent highs. There’s a possibility of some consolidation, the bollinger band needs some contraction imo.
A strong triple-bottom support level has formed at two cents. Should it collapse (not that it will), then it could bounce off 1.6 imo..
Hopefully there should be strong support at around 2.0/2.2.
Although I have a few orders sitting down the line, I took a punt and acquired a small temporary parcel at closing time. Don’t like gambling though lol…
- Forums
- ASX - By Stock
- classic textbook trading
Today's chart..RSI issued a bearish signal at 83.15.Stochastic...
Featured News
AVH
Avita boosts skin restoration product portfolio with 'dermal matrix' – a kind of next-level gauze made of fake skin
STX
Strike hands $48.5M contract to Clarke Energy to produce 20x 4.5MW gas engines for Sth Erregulla
Add PER (ASX) to my watchlist
 (20min delay) (20min delay)
|
|||||
|
Last
7.0¢ |
Change
-0.001(1.41%) |
Mkt cap ! $63.10M | |||
| Open | High | Low | Value | Volume |
| 7.1¢ | 7.1¢ | 6.9¢ | $34.01K | 486.5K |
Buyers (Bids)
| No. | Vol. | Price($) |
|---|---|---|
| 2 | 132919 | 6.9¢ |
Sellers (Offers)
| Price($) | Vol. | No. |
|---|---|---|
| 7.3¢ | 78000 | 1 |
View Market Depth
| No. | Vol. | Price($) |
|---|---|---|
| 2 | 132919 | 0.069 |
| 4 | 134427 | 0.068 |
| 3 | 224490 | 0.067 |
| 1 | 15000 | 0.066 |
| 4 | 32000 | 0.065 |
| Price($) | Vol. | No. |
|---|---|---|
| 0.073 | 78000 | 1 |
| 0.075 | 13371 | 1 |
| 0.078 | 75476 | 2 |
| 0.079 | 175123 | 2 |
| 0.080 | 287231 | 3 |
| Last trade - 16.10pm 02/08/2024 (20 minute delay) ? |
Featured News
TG1
TechGen Metals kicks off airborne geophys survey at Sally Downs copper play – a first for the permit
MTL
Mantle Minerals' Nick Poll talks to HotCopper on finding gold grades up to 3.57g/t at Mt Berghaus
| PER (ASX) Chart |


