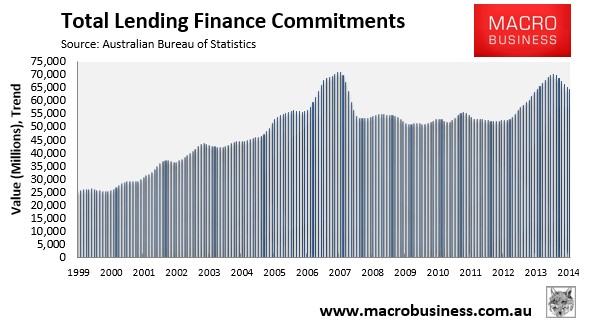
Today’s Lending Finance data, released by the ABS, revealed that total lending continued to fall in December and is well past its peak..
..total finance commitments peaked in June 2014, and have been trending down ever since, down 8.6% since June:
Property prices are especially vulnerable to credit deflation because real estate investors depend heavily on debt financing.
When lending contracts the resultant decline in demand puts a drag on prices. This in turn causes nervous highly leveraged investors to flood the market with homes leading to a glut of houses on the market which only suppresses prices further.
Homeowners only realise that prices are falling after the top is in. And then the rush to sell becomes a panic in an illiquid market.
The most marginal borrowers - FHBs and speculative investors - have been lured into the property market near its peak, as they always do, on high LVRs (many of them on interest only loans). This is especially evident during 2014 as this chart shows (similar to 2007 before a decline in credit led to a decline in house prices).
Given the debt saturation point now reached - with household debt-to-income at record highs - combined with an income recession on rising unemployment and a slowing economy, Australia's housing bubble has reached its tipping point.
House prices in Australia, like all housing bubbles throughout the world and history, was fueled by a credit binge driving prices ever higher. That credit binge has come to an end and, with it, so too has the bubble itself. The long slow deflation of credit, as this chart posted yesterday shows, is a leading indicator and warning sign of the nascent deflation in Australian house prices.