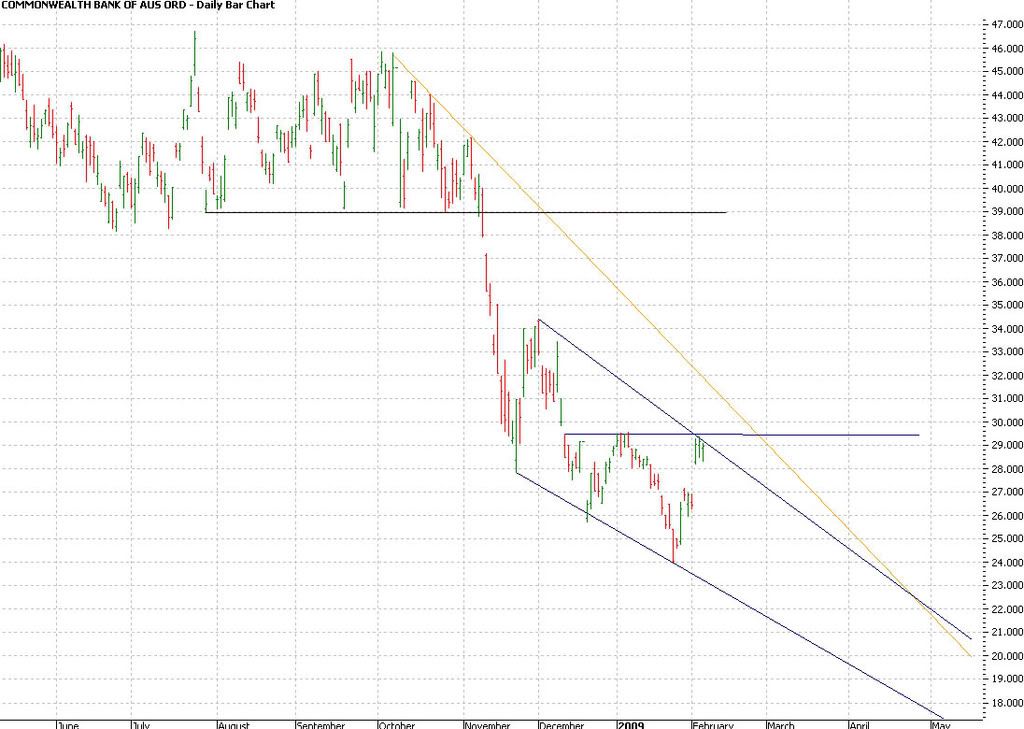
Here is a simple graph ive been looking at the last couple of days. CBA broke support of 39 in November. Its now going in a downwards channel with some additional resistance at around 29.5. There is also a possible upper resistance trendline from October to maybe look out for if it breaks the current resistance. If not, looks like it could be back down to the lower trendline. Im not expert at all, so any comments/criticism/advice is good.
- Forums
- ASX - By Stock
- CBA
- current graph
current graph
-
-
- There are more pages in this discussion • 19 more messages in this thread...
You’re viewing a single post only. To view the entire thread just sign in or Join Now (FREE)
Featured News
Add CBA (ASX) to my watchlist
 (20min delay) (20min delay)
|
|||||
|
Last
$145.06 |
Change
1.210(0.84%) |
Mkt cap ! $241.9B | |||
| Open | High | Low | Value | Volume |
| $144.50 | $145.34 | $144.32 | $97.39M | 672.3K |
Buyers (Bids)
| No. | Vol. | Price($) |
|---|---|---|
| 6 | 75 | $145.06 |
Sellers (Offers)
| Price($) | Vol. | No. |
|---|---|---|
| $145.08 | 18 | 1 |
View Market Depth
| No. | Vol. | Price($) |
|---|---|---|
| 4 | 199 | 145.160 |
| 3 | 212 | 145.140 |
| 2 | 62 | 145.130 |
| 5 | 162 | 145.120 |
| 3 | 80 | 145.110 |
| Price($) | Vol. | No. |
|---|---|---|
| 145.190 | 1 | 1 |
| 145.200 | 410 | 6 |
| 145.210 | 150 | 2 |
| 145.220 | 53 | 2 |
| 145.230 | 506 | 4 |
| Last trade - 13.33pm 06/11/2024 (20 minute delay) ? |
Featured News
| CBA (ASX) Chart |


