Hi Volt & others
I have been lurking for a while trying to learn the black art and have discovered that I'm a hopeless day trader. I tend to buy at the top and sell at the bottom most of the time even when I'm tracking the stochastics and MACD crossovers. Am I missing something really basic?
I'm also pretty hopeless at interday trading - maybe I sell too early when I should hold on. There is one thing that I think I have a handle on which is the cycles. I only have historical DJI data at the moment so the graph below is my model for the DJI from Jan-June this year current to the 7th June. It appears to have a high degree of correlation with the actual data. I get the highest correlation coeffcients with the 5 & 10 year cycles rather than the 4 & 10 year.
The blue line is the prediction, the white is the actual and the yellow is the bollinger bands for the prediction.
You should notice my model predicts next week will be up - much in line with Jaolsa's prognostications.
Hence I think I should try index trading, so my first question: What alternatives are there for index trading other than CFDs?
I'd also be greatful if anyone can point me to historical SPX data or XJO data.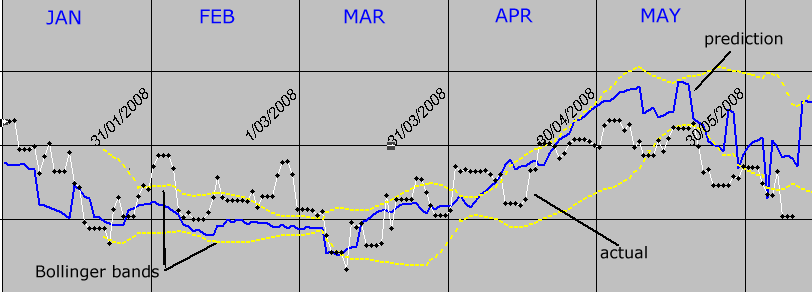
cycles n things


Add XJO (ASX) to my watchlist
 (20min delay) (20min delay)
|
|||||
|
Last
8,013.4 |
Change
31.000(0.39%) |
Mkt cap ! n/a | |||
| Open | High | Low |
| 7,982.4 | 8,030.3 | 7,982.4 |
| XJO (ASX) Chart |