@tanon
FWIW
http://www.liberatedstocktrader.com/which-month-is-the-best-to-buy-stocks/
Which Month is the Best to Buy Stocks?
By
Barry D. Moore - Member Society of Technical Analysts (MSTA/IFTA)
-
January 11, 2015
118
Share on Facebook
Tweet on Twitter
A common question I get asked by students is “Which is the best month to buy stocks?”. It is a good question and although each day week and month is different from year to year there are common trends across the decades, we will seek to answer the questions using 35 years of statistical data.
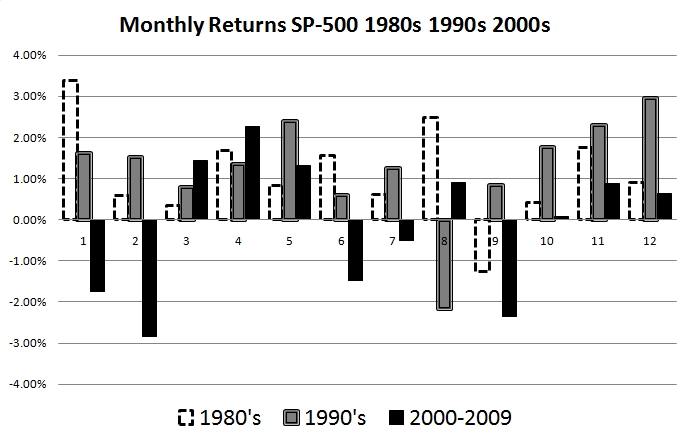
The following chart is an extract from the Liberated Stock Trader Book, it analyses the returns from the Standard & Poors 500 index for the last 30 years. They are the average monthly returns in percent broken into decades, 1980 to 1989, 1990 to 1999 and 2000 to 2009.
Extract from the Liberated Stock Trader Pro Training – All Rights Reserved 2011
You can see that for the last three decades March, April May, October, November, and December were the only months that registered positive returns. You can also see from the three decades the last ten years (2000 to 2009) have been the worst in terms of total returns.
Seasonal Effect in the stock Market
There is a seasonal effect and it does repeat itself. This could be due to a whole host of factors, retail sales, summer commodities harvest and the build up to the Christmas selling period. Ultimately the state of the economy and the governments stewarding of fiscal and monetary policy play a leading role here. We know that the 80’s and 90’s were decades of unprecedented growth and the 2000’s was a decade of payback with two severe crashes the Dotcom bust (2000) and the Financial Crisis (2007), this is reflected in the chart above. From 1980 to 2000 January to June were positive and October to December also, leaving only August and September not 100% positive in terms of gains. That is 10 of the 12 months.
From 2000 to 2009 5 of the 12 months were negative January, February, June July and September.
Let’s bring the research up to date
But what are the results from from the five years from 2010 to 2014?
The below chart brings the research up to date with the latest 5 years of data. Here we can see that January to April have been been strong, also July and September through to December. Only three of the 12 month being on average losers.
Stock Market Returns Monthly from 2010 to 2014 – Source S&P 500 – All Rights Reserved Liberatedstocktrader.com
So what does this mean for us. Well, statistically, September through to April have been good months, with the summers being a little hit and miss. The stock market proverb “Sell in May and go away” has returned and holds true for the last 5 years.
day trading 12/05 pre market, page-12
-
- There are more pages in this discussion • 23 more messages in this thread...


You’re viewing a single post only. To view the entire thread just sign in or Join Now (FREE)
Featured News
Featured News
The Watchlist
BM8
BATTERY AGE MINERALS LTD
Nigel Broomham, CEO
Nigel Broomham
CEO
Previous Video
Next Video
SPONSORED BY The Market Online