exit I know and agree, your line stems from July low if i'm not wrong. That line from March 09 lows should hold some good support imo but agree all looks vulnerable! That gap at 4501 XJO a worry plus look at the daily DJIA chart from this morning, hanging on for grim life on that support at around 11000. I'm looking at the weekly stochastics but they are not even at the mid line (pointing down albiet) so hopr they don't have to see oversold or we could be in for some hefty downside. I am also watching the weekly USD chart with interest as that trend line above looks to be the target. Would be surprised to see it come off pretty hard when it gets it (if it gets hit) imo.
Here's the chart for anyone that missed it. All IMO of course.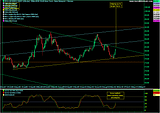
daytrades december 1 morning ..., page-115
-
- There are more pages in this discussion • 47 more messages in this thread...


This thread is closed.
You may not reply to this discussion at this time.
You’re viewing a single post only. To view the entire thread just sign in or Join Now (FREE)