Morning HLL & All.
US Market Results (10 min charts) :


US retail sales climb, inflation calm
Reuters
WASHINGTON - The US economy closed out 2010 on a softer note than expected, with rising gasoline prices eroding consumers' purchasing power in December even as they helped lift retail sales.
Retail sales climbed 0.6 per cent last month, the Commerce Department said. The sixth straight monthly increase showed consumers doing their part to support recovery, even though the data was a bit weaker than forecast by economists.
A separate report from the Federal Reserve showed US industrial output rose 0.8 per cent in December, the biggest gain since July, as a cold weather snap pushed utility production sharply higher.
"Things should continue to roll along but no one's getting any sense that there's any underlying gusto or that the economy's got any heat in it at all," IHS Global Insight's Brian Bethune said in Lexington, Massachusetts.
A spike in gasoline prices last month helped lift the Consumer Price Index by 0.5 per cent, the fastest pace in 1-1/2 years, although prices gained just 0.1 per cent excluding volatile food and energy costs, the Labor Department said.
The rise in gasoline prices weighed on consumer sentiment, while another report showed business inventories grew much less than expected in November as sales kept up a strong pace.
The raft of data was in line with other recent signs the world's biggest economy strengthened somewhat in the final months of the year, although the pace of growth fell short of what is needed to make a big dent in unemployment.
Stocks rose modestly on Friday, bolstered by JPMorgan Chase earnings and a stronger first-quarter outlook for chip-maker Intel. JPMorgan Chase Chief Executive Jamie Dimon said demand for credit was growing.
Prices for US government debt initially rose as the lukewarm data suggested the economy was not accelerating sharply. But prices drifted lower as a three-day weekend loomed.
Commodity price pressure
Fed chairman Ben Bernanke said on Thursday the economy was "moving in the right direction" with the risk of troubling deflation falling. The latest batch of economic reports appeared unlikely to budge the Fed from its $US600 billion bond buying program.
"There will be a time when these aggressive actions need to be reversed, but first we need to get the economy on a much more solid footing," Boston Federal Reserve Bank President Eric Rosengren said.
In December, sales declined at electronics and general merchandise stores, but those drops were offset by increases in sales of gasoline, building materials and automobiles.
Sales for all of 2010 reversed two years of contraction with the biggest gain in more than a decade.
A strengthening of global demand, especially in fast-growing emerging economies, has lifted commodity prices and has led to a quickening in US overall inflation.
The 1.6 per cent increase in gasoline station sales last month reflected the rise in prices at the pump. Average gas prices rose about 20 cents in December to $US3.05 a gallon.
That increase chilled consumer sentiment in January and raised inflation expectations, according to the Thomson Reuters/University of Michigan survey. However, optimism on the future rose.
Overall consumer prices rose 1.5 per cent from the same month a year ago, while core consumer prices gained 0.8 per cent in 2010, the slowest calendar year increase on record dating to 1958.
DJIA daily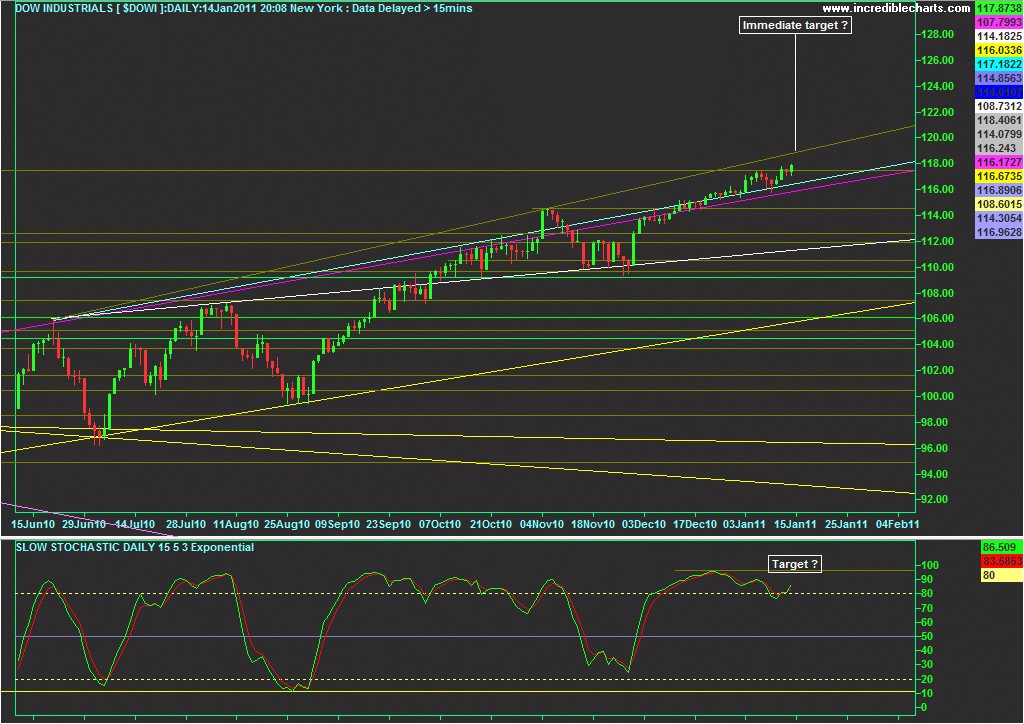
DJIA weekly (2.5 year chart)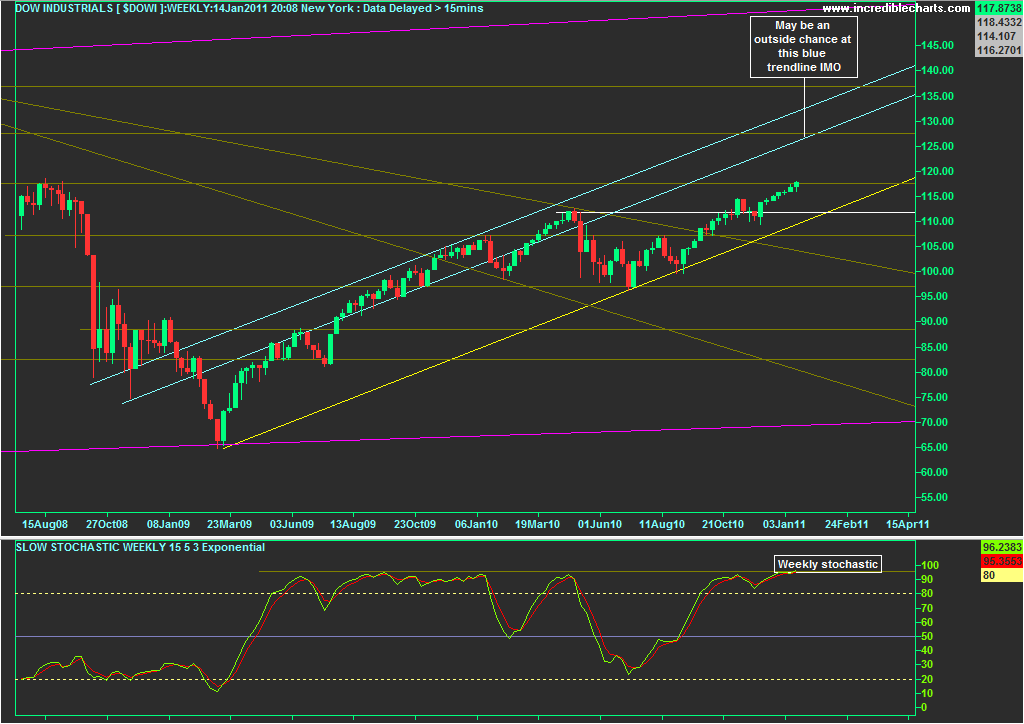
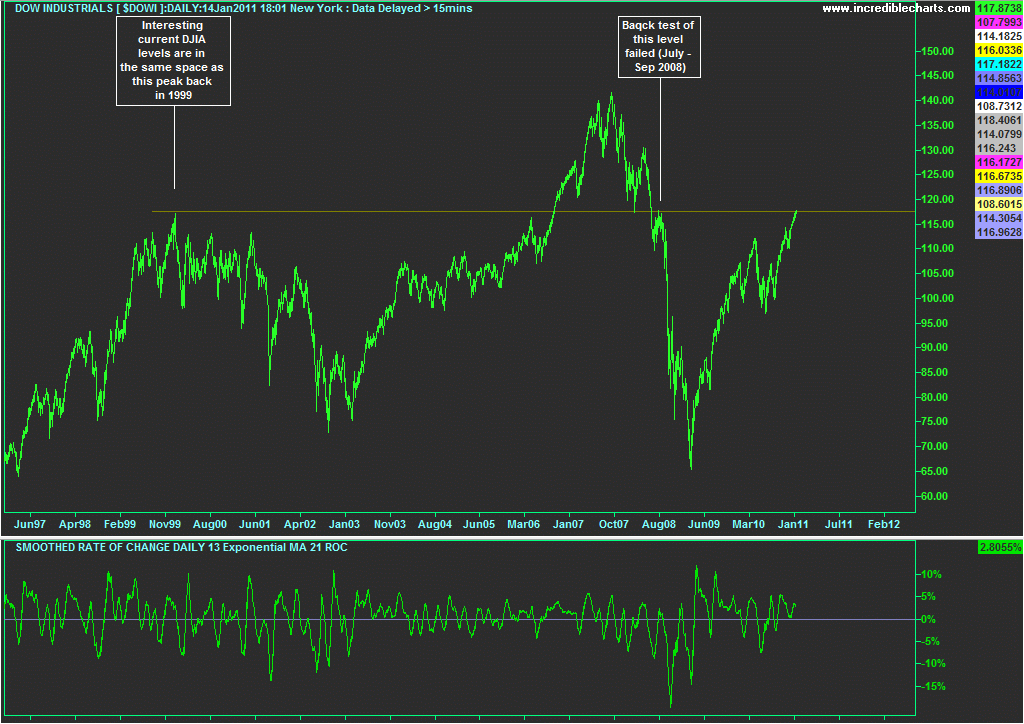
Below is a 14 year daily DJIA line chart. The index price has only managed to breakout above the current resistance level on one other occasion, from Oct 06 - June 08. The question is whether the recovery in the US presently is as strong as the bullishness in the period mentioned (well up to the end of 07 anyway)?
DJIA 14 year (daily) line chart
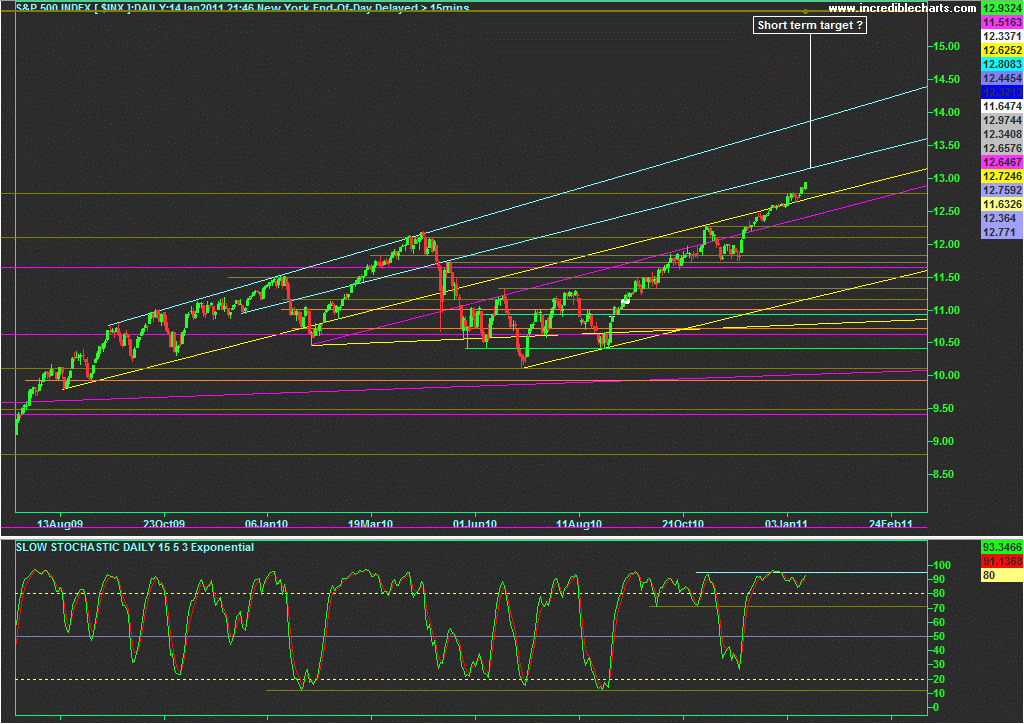
SPX daily
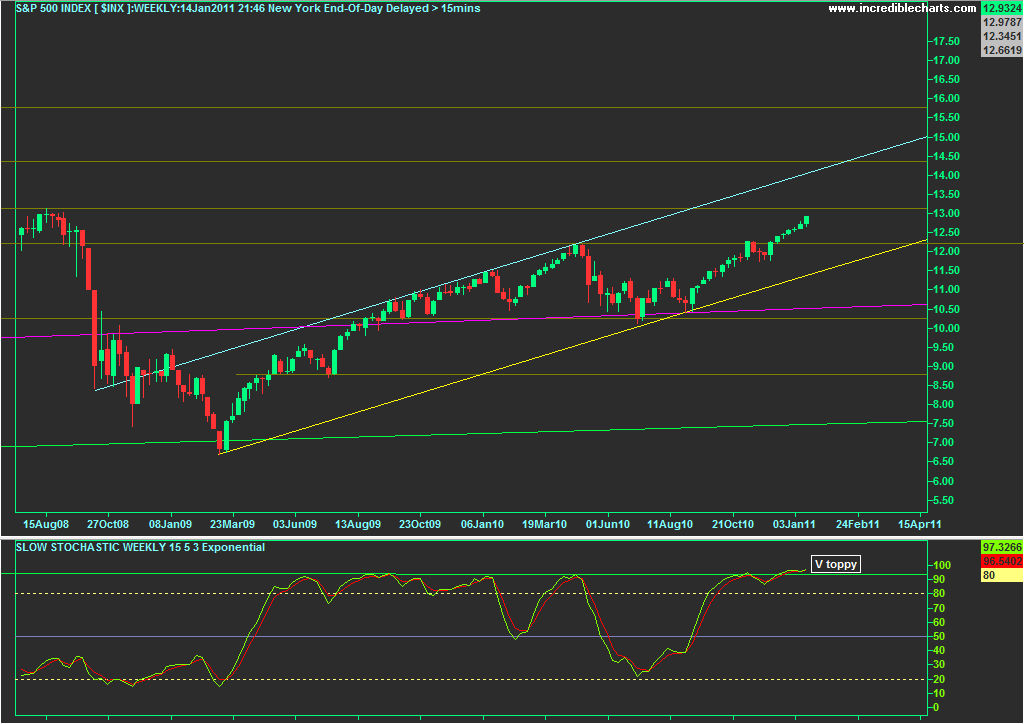
SPX weekly
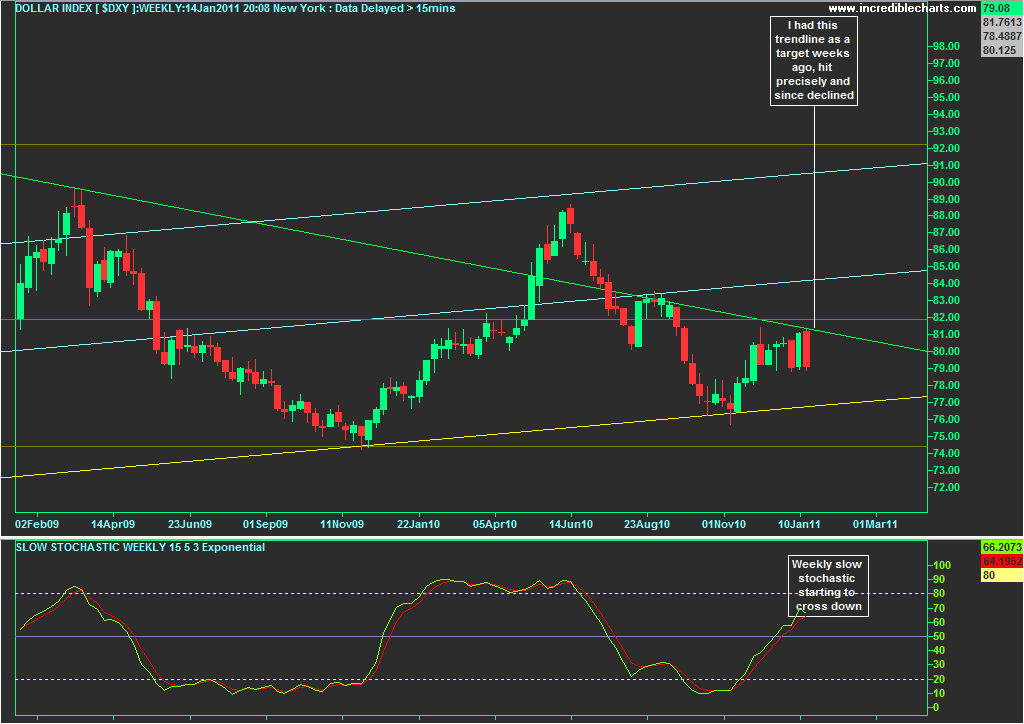
USD weekly (2 years)
USD weekly (12 years)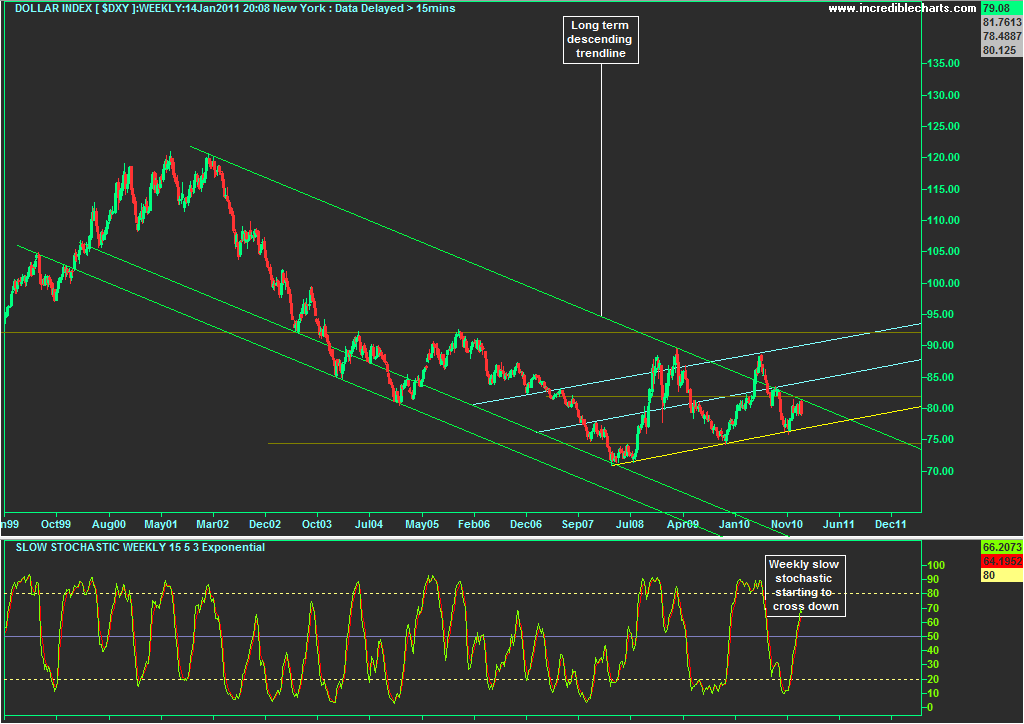
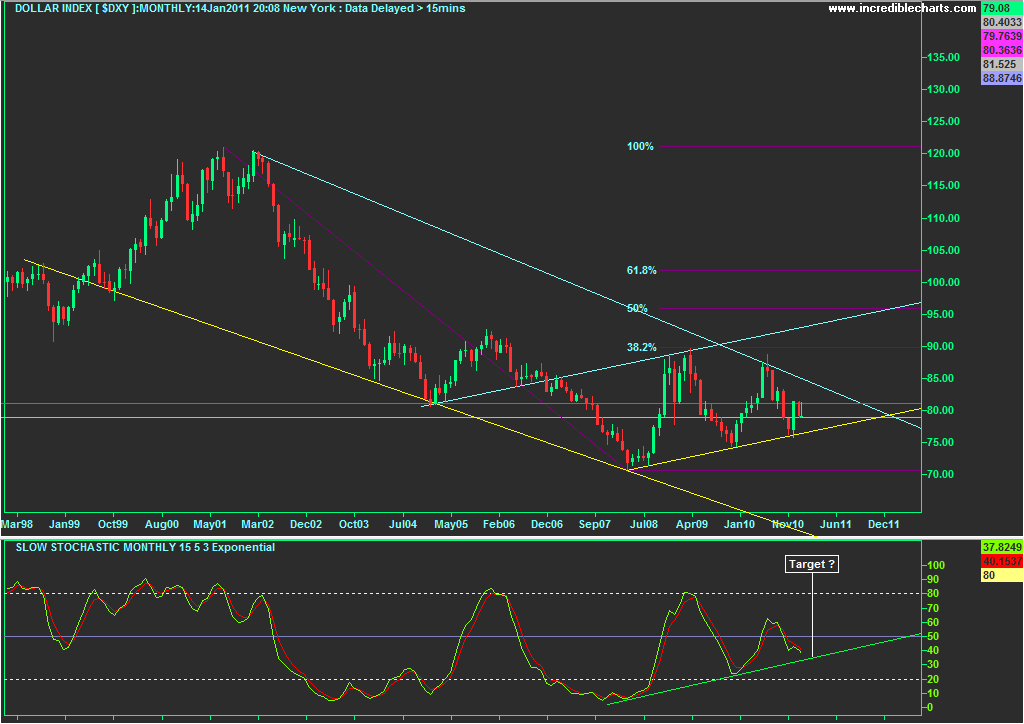
USD monthly chart (13 years) with monthly slow stochastic
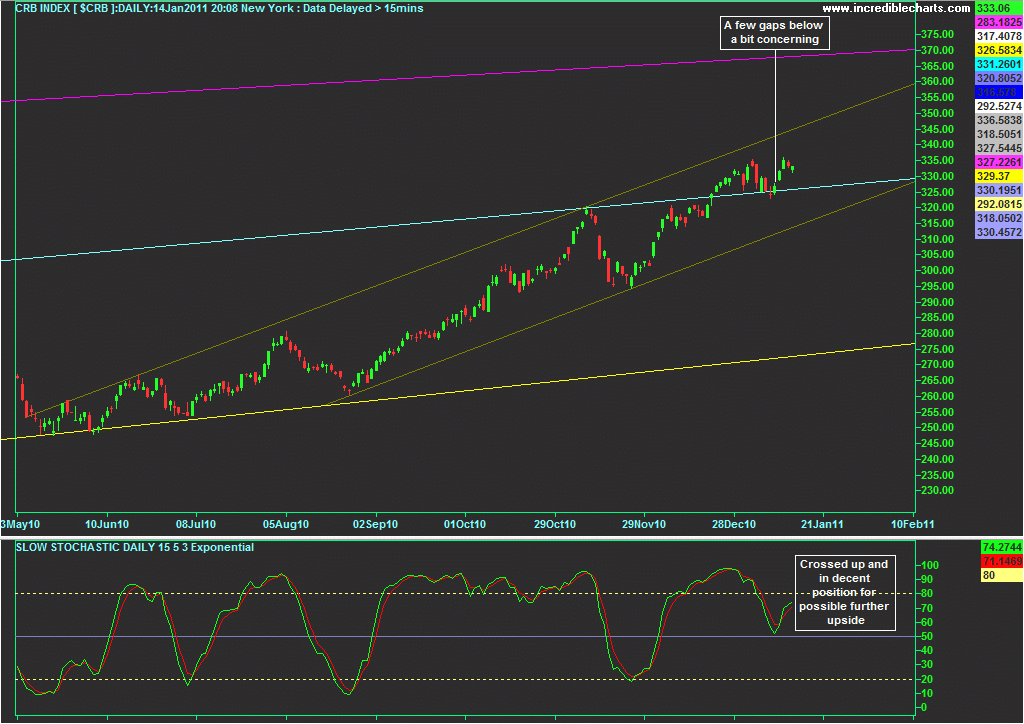
CRB (commodity index) daily chart (8 months)
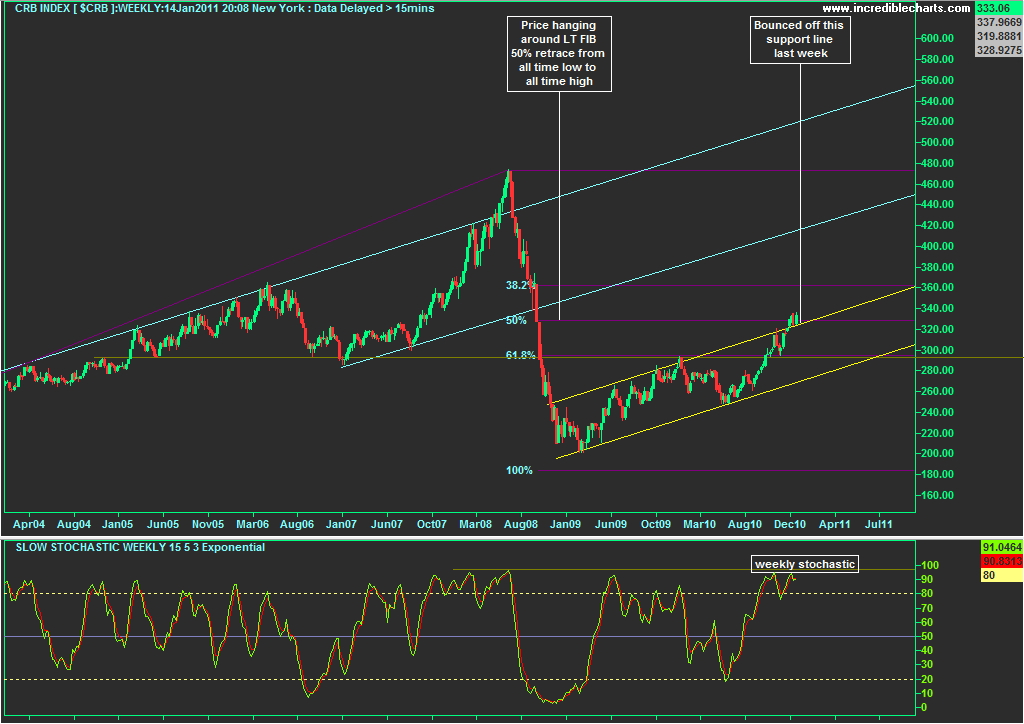
CRB weekly chart (7 years)
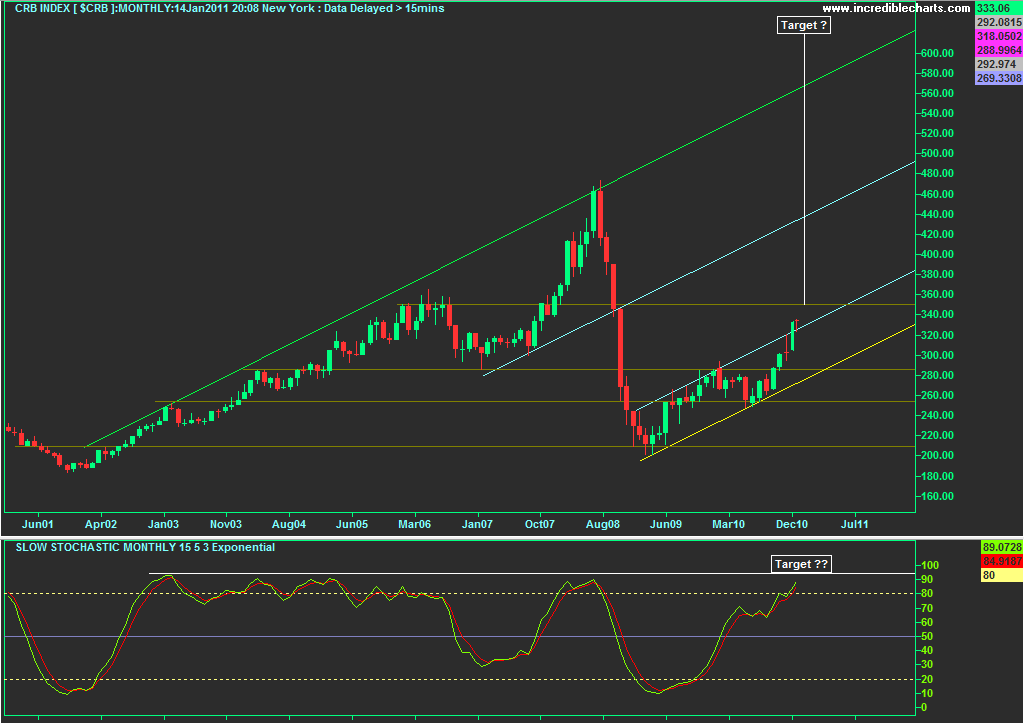
CRB 10 year monthly chart with monthly slow stochastic
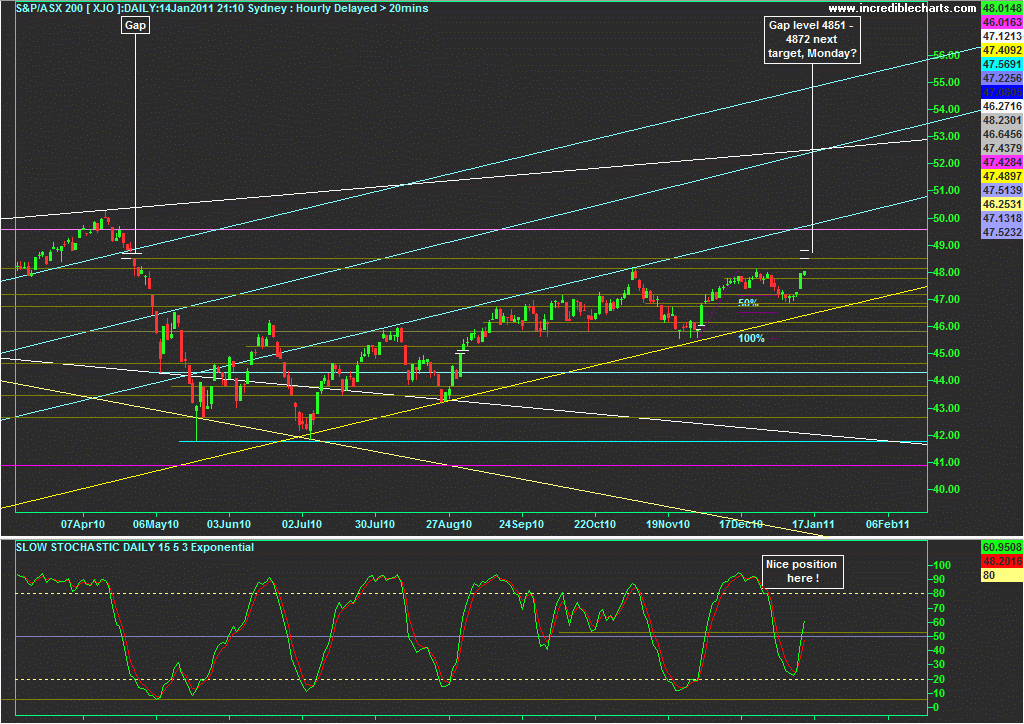
XJO daily
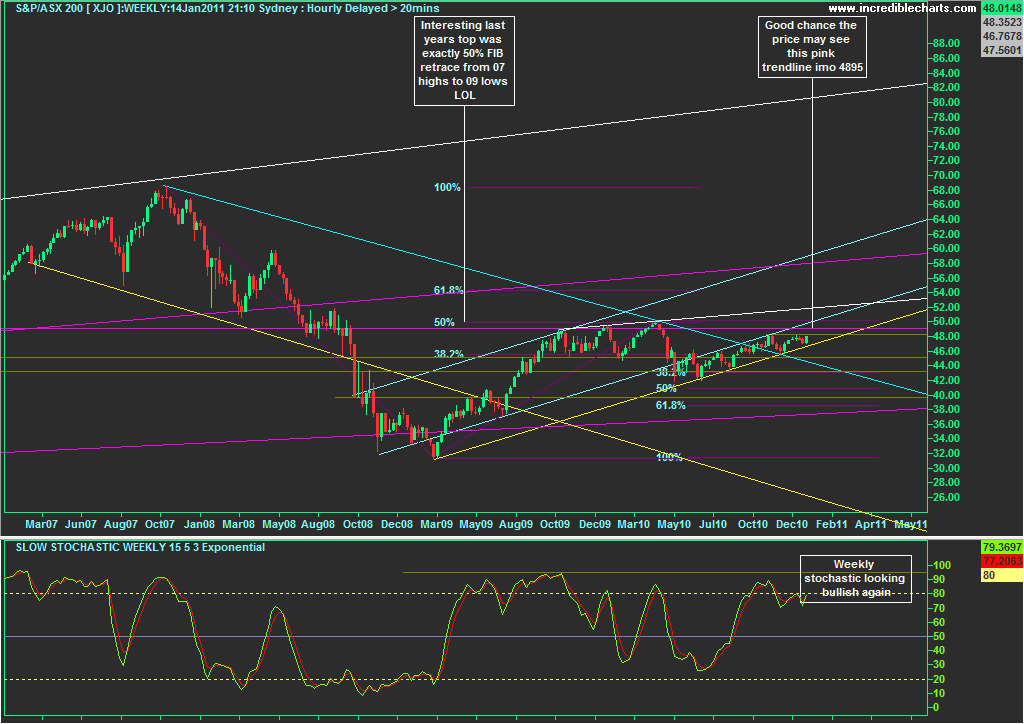
XJO weekly chart with weekly slow stochastic
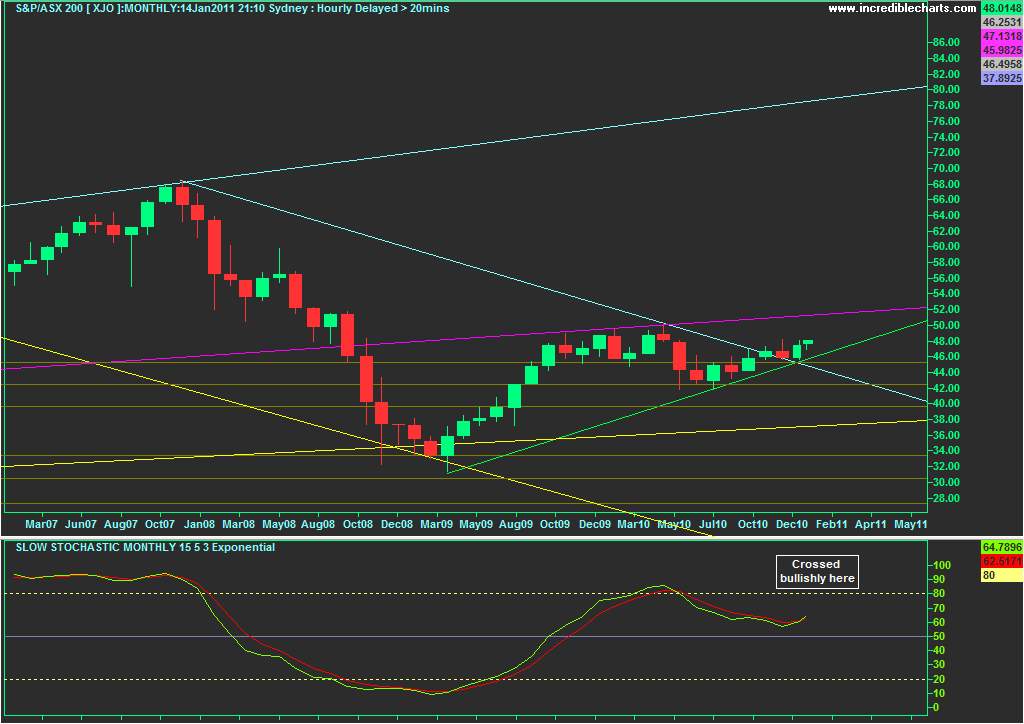
XJO monthly ( 4 years) with monthly slow stochastic
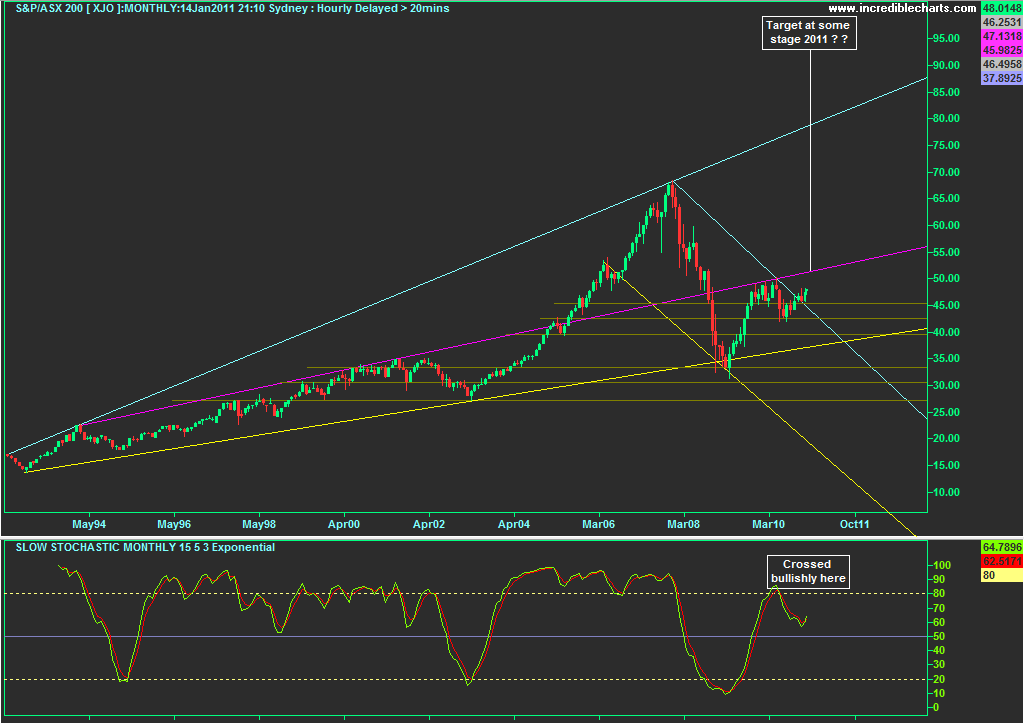
XJO monthly (18 years) with monthly slow stochastic
Futures (daily charts) :


- Forums
- ASX - Day Trading
- daytrades jan 17 pre-market
Morning HLL & All.US Market Results (10 min charts) : US retail...
-
- There are more pages in this discussion • 31 more messages in this thread...
This thread is closed.
You may not reply to this discussion at this time.
You’re viewing a single post only. To view the entire thread just sign in or Join Now (FREE)


