Morning & thanks HLL, Morning All,


Wall St flat on global economic outlook, oil
Published 0:11 AM, 10 Mar 2011 Last update 6:59 AM, 10 Mar 2011
Reuters
NEW YORK - The Nasdaq fell on Wednesday after a weaker-than-expected target from Texas Instruments, and analysts saw further weakness for the chip sector.
Rising oil prices dragged on the broader market on the two-year anniversary of stocks' bull run from the S&P 500's 12-1/2-year closing low of 676.53, which was sparked by the financial crisis.
An index of semiconductor shares was down 2.9 per cent and was trading below its 50-day moving average in another sign of more losses for the sector.
Texas Instruments shares fell 3.1 per cent to $US34.74, a day after the company gave a current-quarter earnings estimate below Wall Street's estimates.
"I think the markets are ready for a sell-off that continues to be started by the Nasdaq futures markets," said Harry Michas, technical analyst and stock index futures trader at Iharmarketmonitor.com.
"If the Nasdaq futures fall back below the 2,313.00 level again, it should attract more profit taking as well as some new shorts." The futures were trading around 2,316.
Bucking the tech trend, the Dow bounced back from a session low and reclaimed a slim gain as buyers snapped up shares of International Business Machines Corp.
The stock hit an intraday high of $US167.72, its highest since 1973, after a host of analysts raised their target price on the stock. A day earlier, the tech giant reaffirmed its 2015 earnings target.
Even though semis' gains have outpaced the broader market in the last several months, the S&P 500 and the semiconductor index have been moving in the same direction, which could mean further declines in the sector and spell more of the same for the overall market.
A 20-day correlation between the S&P 500 and the semiconductor index was at 0.77, with a reading of 1 suggesting a perfect correlation.
The semiconductor index is up 41 per cent since the start of September, when the recent rally began, while the S&P 500 is up 26 per cent.
Tech shares also felt the weight of Finisar Corp, which plummeted 35.9 per cent to $US25.68 after the network equipment maker forecast a dismal fourth quarter, blaming an inventory pile-up by telecommunications equipment makers in China.
Finisar is up 100 per cent since the start of September, when the recent stock market rally began.
IBM's stock was last up 2.4 per cent at $US166.08.
"The stock is going against tech in general this past week," said Michael Quigley, tech analyst at Wedgewood Partners in St. Louis. "It is a great business, and we always have our eye on it."
In the oil market, Brent crude gained $US2.57 to $US115.63 a barrel as turmoil in Libya continued. The higher prices reinforced worries that high energy costs could dampen economic growth.
Libyan forces loyal to Muammar Gaddafi surrounded rebels in the western city of Zawiyah with tanks and snipers in the main square, witnesses said.
Adding to concerns about the global economy, the Portuguese government's two-year cost of borrowing hit the highest level since it joined the euro in a bond auction on Wednesday, and an official said yields were unsustainable in the long run without Europe-wide action
------------------------------------------------------------
Just going to focus on the XJO & XAO charts this morning
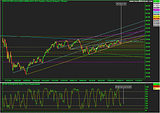
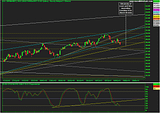
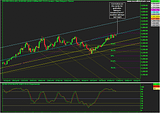
XJO (2.5 year daily chart), excuse the mess on this chart but it's just to show the origin of the trendline that just got hit.
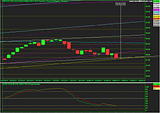
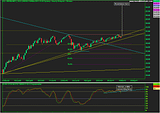
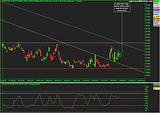
XJO daily (Close up)
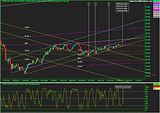
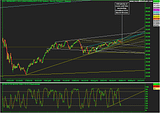
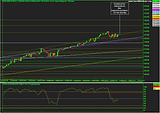
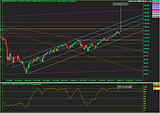
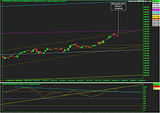
XJO WEEKLY - As indicated by the (*) the price has breached the yellow ascending trendline on several occasions (over the last few years) only to finish the week above. I wouldn't expect any different this week IMO. One thing I will say is that if the price closes lower than the trendline on the DAILY (above chart) then it's a different story as this would obviously mean that the weekly line has been breached and then yes the uptrend is broken IMO. If this plays out 4500 (ish) should catch it imo
XAO daily
XAO Close up
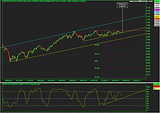
XAO Weekly
DJIA Daily
DJIA Weekly
GOLD
VIX
CRB
AUD
FUTURES - Daily charts today


- Forums
- ASX - Day Trading
- daytrades march 10 morning
daytrades march 10 morning
-
- There are more pages in this discussion • 166 more messages in this thread...
You’re viewing a single post only. To view the entire thread just sign in or Join Now (FREE)
