SP500 30 minute for the past month plus showing the higher double bottom at 1136 and now a second one higher up tied up with a lower double top. The further the time between the first or second top or bottom the more significance the pattern should have.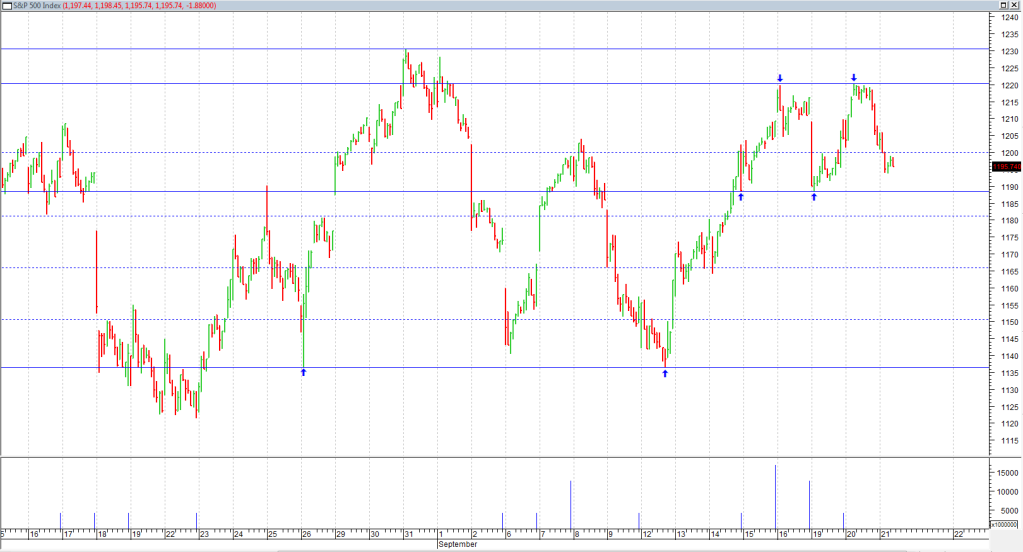
The bigger picture for the emini s&p 500 and looks as though the h&s pattern is playing out down to 1175 where it should get a bounce? If it gets there in the afternoon trading I shall be looking for a set up for a bounce from there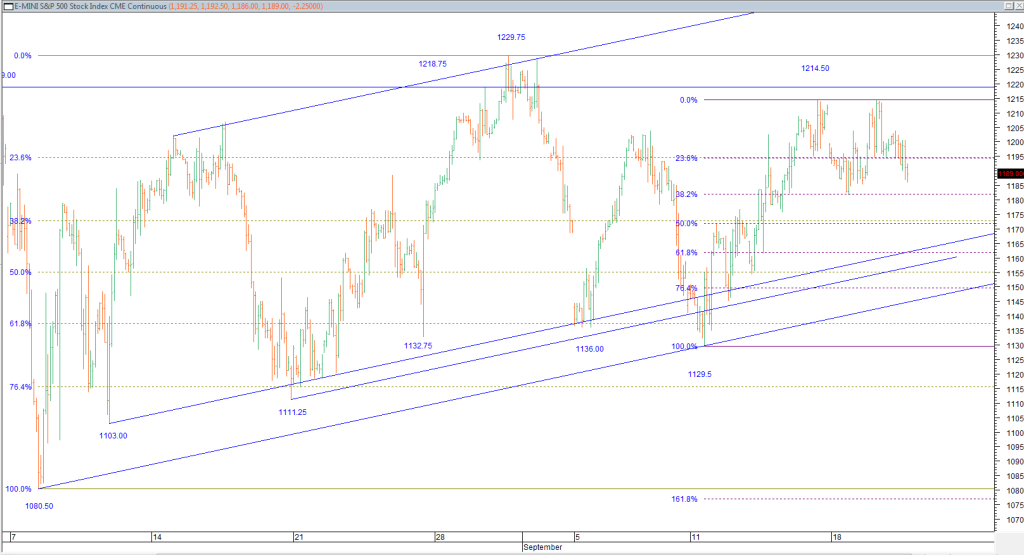


Add to My Watchlist
What is My Watchlist?
 (20min delay) (20min delay)
|
|||||
|
Last
8,590.7 |
Change
1.400(0.02%) |
Mkt cap ! n/a | |||
| Open | High | Low |
| 8,589.1 | 8,610.0 | 8,550.2 |
| XJO (ASX) Chart |