realise this is an FA thread and that stuff is just to much for me , Seems it always factors more opinion/ emotion than just looking at the chart ( which is just the unencumbered fact)
Few stocks have been as technically compliant as this in short terms recently and it has been technically buoyant against the prevailing market sentiment.
So why not just trade this when the new long trend is clearly confirmed...Yes Theres heaps of TA manipulation and fine tuning nonsense that few sharp day traders may use however and I must agree that so many TA indicators end up no better off than an investor just holding a stock.
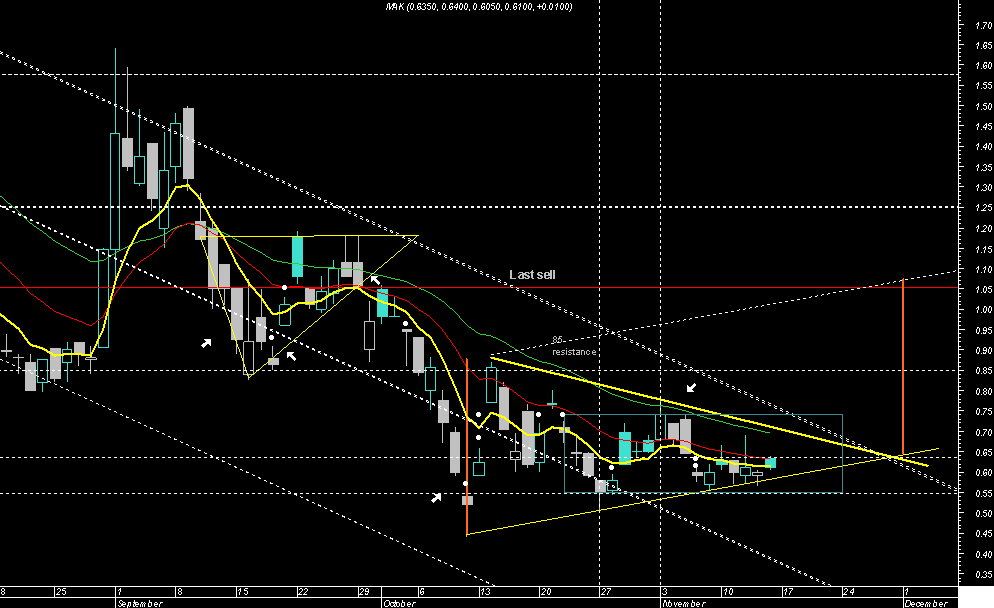
The best consistent performance indicator is the trend...MAK is still undecided about this and appears it will break either way very soon...this chart says its a buy above a 69 close and a sell below a 55 close...thats not much of a range to wait for considering some of the FA potential discussed or is it ???? lol thats where I came in
PS
check this site to see how equally fallible charting can be
http://www.technicalanalysis.org.uk/taxonomy.html
do not be too overexposed, page-96


Add AEV (ASX) to my watchlist
 (20min delay) (20min delay)
|
|||||
|
Last
1.3¢ |
Change
0.000(0.00%) |
Mkt cap ! $35.15M | |||
| Open | High | Low | Value | Volume |
| 1.3¢ | 1.3¢ | 1.2¢ | $10.10K | 780.0K |
Buyers (Bids)
| No. | Vol. | Price($) |
|---|---|---|
| 9 | 3524280 | 1.2¢ |
Sellers (Offers)
| Price($) | Vol. | No. |
|---|---|---|
| 1.3¢ | 1224503 | 3 |
View Market Depth
| Last trade - 13.41pm 04/09/2024 (20 minute delay) ? |
| AEV (ASX) Chart |