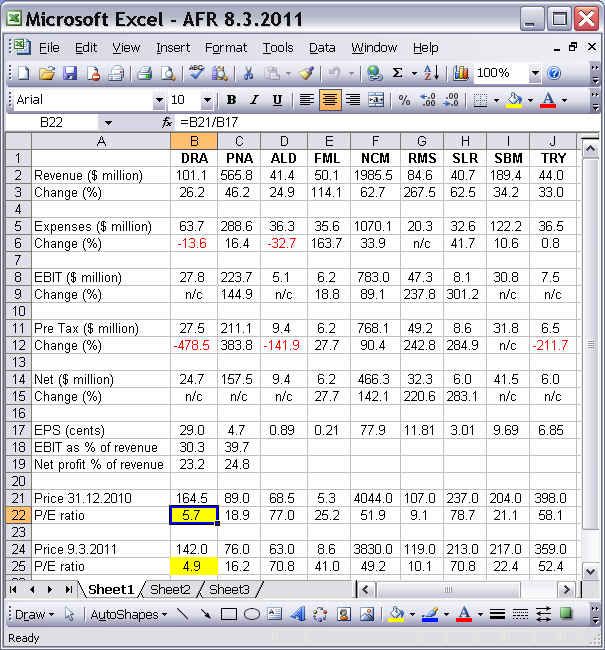
Below is a table of profit numbers published in the AFR last Tuesday.
DRA and PNA are Preliminary Final Reports.
All others are Interim Reports.
The P/E numbers are my calculations and are trailing P/Es.
The DRA P/E number at end of 2010 was 5.7. It's now 4.9.
You could conclude the manipulation efforts demonstrate a devaluation of 14% (4.9/5.7) amid a backdrop of rising PoG and increasing resource statements.

Add to My Watchlist
What is My Watchlist?


