Perhaps another view..
I know you are talking TA principles here but Gosh Monthly Charts is pushing it a bit,
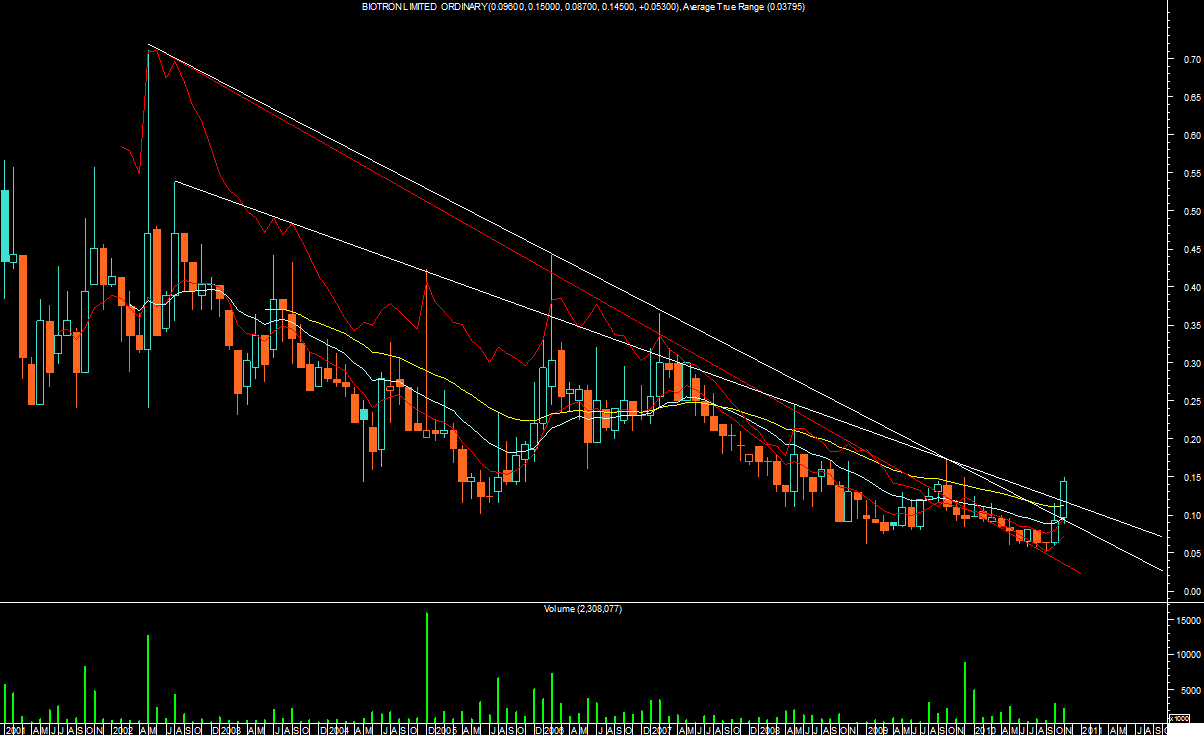
The ATR is overlaid in red on this chart
It is not using price Y axis scale and for accuracy sake is likely to have a higher start point
(Its a metastock problem)
I consider spikes as volatility aberrations and need averaging by (ATR's) Average True Ranges or Standard deviations
ATR Link
dynamic trend lines, page-6


Featured News
Featured News
The Watchlist
NUZ
NEURIZON THERAPEUTICS LIMITED
Dr Michael Thurn, CEO & MD
Dr Michael Thurn
CEO & MD
SPONSORED BY The Market Online