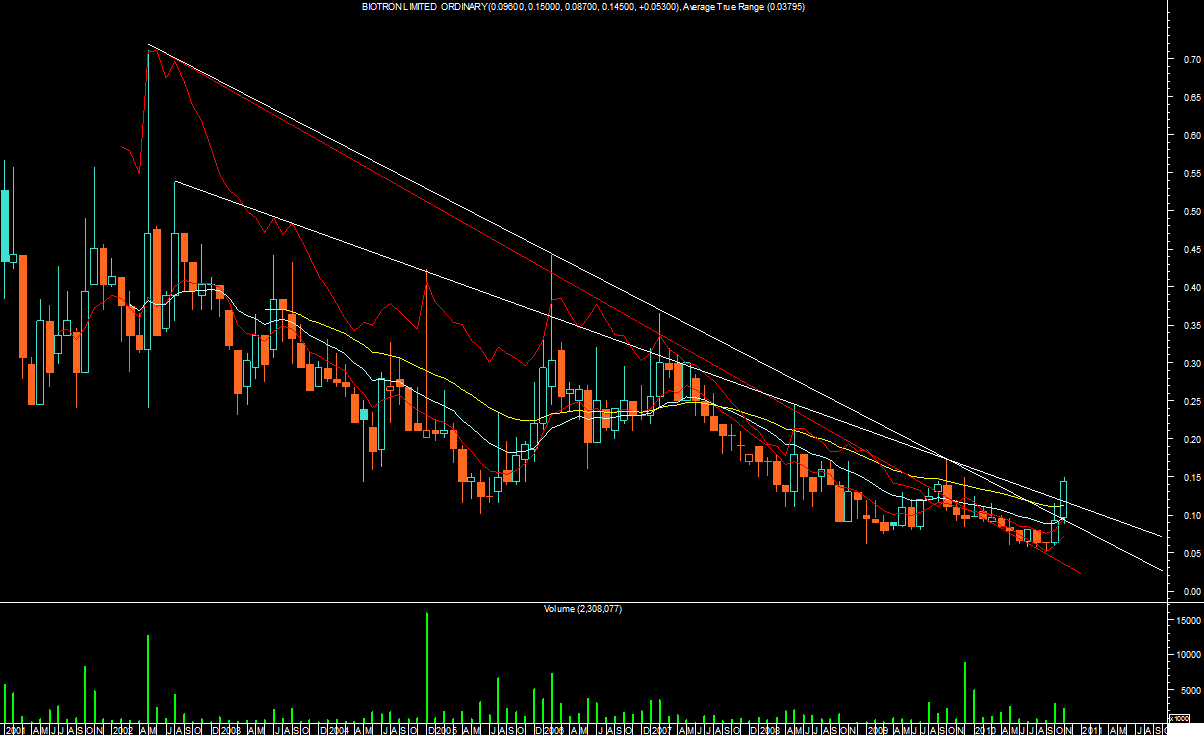
Perhaps another view..
I know you are talking TA principles here but Gosh Monthly Charts is pushing it a bit,
The ATR is overlaid in red on this chart
It is not using price Y axis scale and for accuracy sake is likely to have a higher start point
(Its a metastock problem)
I consider spikes as volatility aberrations and need averaging by (ATR's) Average True Ranges or Standard deviations
ATR Link
- Forums
- Charts
- dynamic trend lines
Perhaps another view..I know you are talking TA principles here...
Featured News
Featured News
The Watchlist
AGC
AUSTRALIAN GOLD AND COPPER LTD
Glen Diemar, MD
Glen Diemar
MD
SPONSORED BY The Market Online


