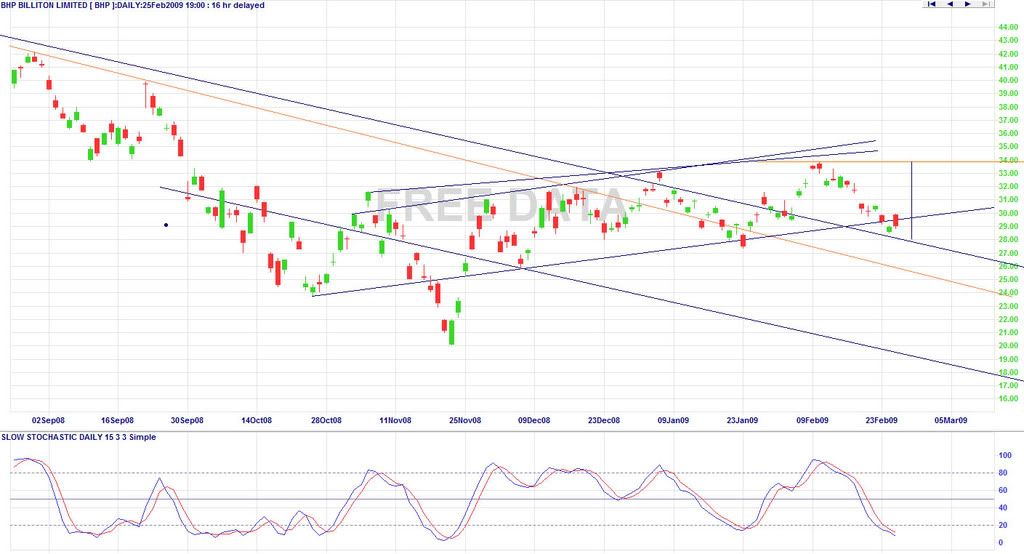
Hey Robbbbb. Nice chart. I tried to recreate some one of your trend lines, and the speed angles. I think i was pretty exact by zooming in etc, and it looks like the speed angle would take it down too 28.015? Also where my trend line today would have also been exactly 28.015... tommorow around 27.9
"Price action in afternoon session should give a clear indication of trend for coming few days."
Was the last minute sell off a sign of a downtrend for the next few days? Or do you still have a short term target of $31 since the stochastic will probably cross over tommorow?
I think I may have also found another trend line which started back in August 08 (orange one). See attatched chart (Doesnt have todays candle yet).
Also, what do people think of Incredible charts premium data? The charting package seems to work pretty well. I would prefer Hubb trader's brother program, as it just seems more clean to find trend lines etc, but its way out of my price range haha.
I also had pro trader with Commsec, does anyone know how the IRESS thing is compared? Is it good for charting?
- Forums
- ASX - By Stock
- BHP
- elliot wave analysis bhp daily
elliot wave analysis bhp daily, page-124
Featured News
Add BHP (ASX) to my watchlist
 (20min delay) (20min delay)
|
|||||
|
Last
$42.68 |
Change
-0.470(1.09%) |
Mkt cap ! $216.4B | |||
| Open | High | Low | Value | Volume |
| $42.71 | $43.20 | $42.68 | $463.8M | 10.82M |
Buyers (Bids)
| No. | Vol. | Price($) |
|---|---|---|
| 1 | 13572 | $42.68 |
Sellers (Offers)
| Price($) | Vol. | No. |
|---|---|---|
| $42.70 | 457 | 1 |
View Market Depth
| No. | Vol. | Price($) |
|---|---|---|
| 3 | 1234 | 42.670 |
| 3 | 514 | 42.660 |
| 8 | 4807 | 42.650 |
| 1 | 588 | 42.640 |
| 3 | 1292 | 42.630 |
| Price($) | Vol. | No. |
|---|---|---|
| 42.800 | 610 | 1 |
| 43.000 | 1600 | 1 |
| 43.050 | 1700 | 1 |
| 43.150 | 4965 | 7 |
| 43.170 | 494 | 2 |
| Last trade - 16.10pm 28/06/2024 (20 minute delay) ? |
Featured News
| BHP (ASX) Chart |
The Watchlist
LU7
LITHIUM UNIVERSE LIMITED
Alex Hanly, CEO
Alex Hanly
CEO
SPONSORED BY The Market Online


