Even a filthy leperous bear like myself can see the strength in the market indicators that say maybe this time it is different. Dunno if anyone has looked the NY advancers decliners now compared to the may rally. In may they were fairly evenly matched through that rally...yet the market rose. We know at that time financials continued to be smashed and, because of a low USD, resources were rising. this eventually set up a Hindenburg omen and the may rally ended in tears. this time it is different. Advancers seem to be out weighing decliners significantly which indicates the market rise is being more evenly spread across sectors.
That all said I think we are due for a pullback now because :
1. the first real chart resistance (see chart below) has been reached
2. volume has dropped off in the last 3 days in the US (again see chart below)
3. The dow has just popped through the 55 dma. this is where bear reactions usually end and may intimidate a fair few traders for now even if this really is a new bull.
4. the USD has found support at the 144 dma which it has a bit of history with...it has also formed a little ascending triangle. More often than not the USD, at least lately, moves counter to the market as that is where money not in the market seems to flow.
5. new moon yesterday.
on the down side the only reason I can see for a new bull is terrible inflation figures heading our way soon.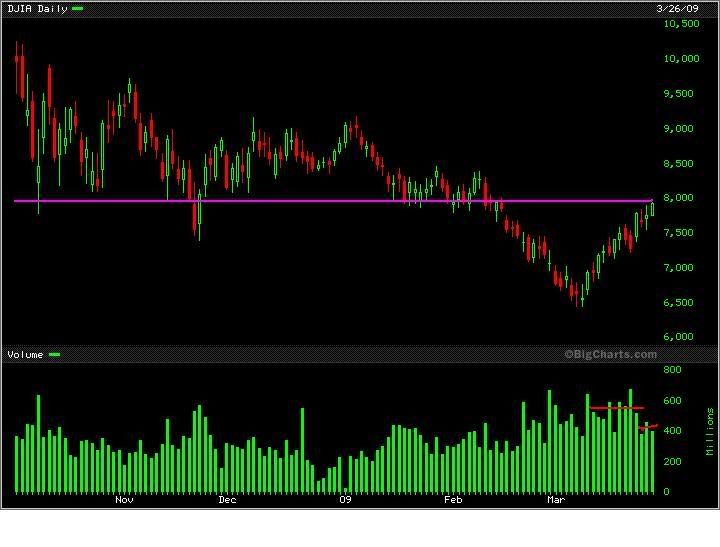
end of the bear bounce friday, page-35


Add XJO (ASX) to my watchlist
 (20min delay) (20min delay)
|
|||||
|
Last
7,987.9 |
Change
-24.000(0.30%) |
Mkt cap ! n/a | |||
| Open | High | Low |
| 8,011.9 | 8,024.5 | 7,963.9 |
| XJO (ASX) Chart |