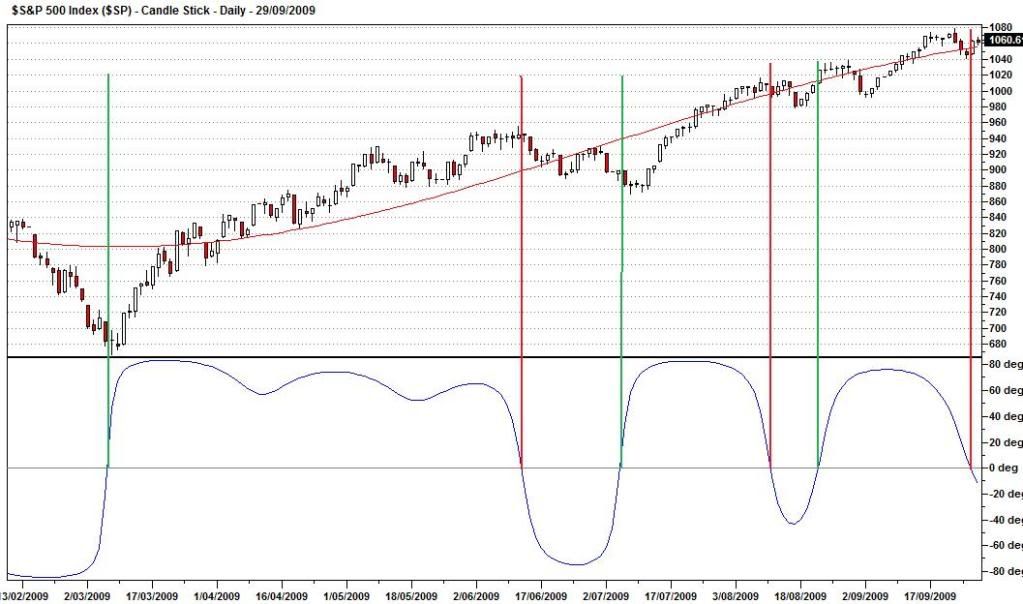
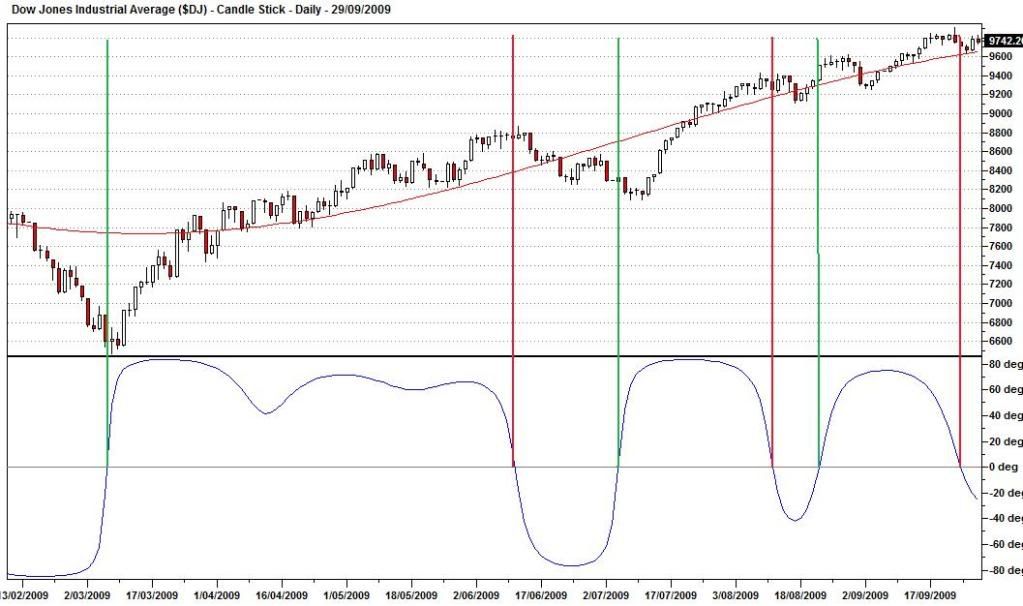
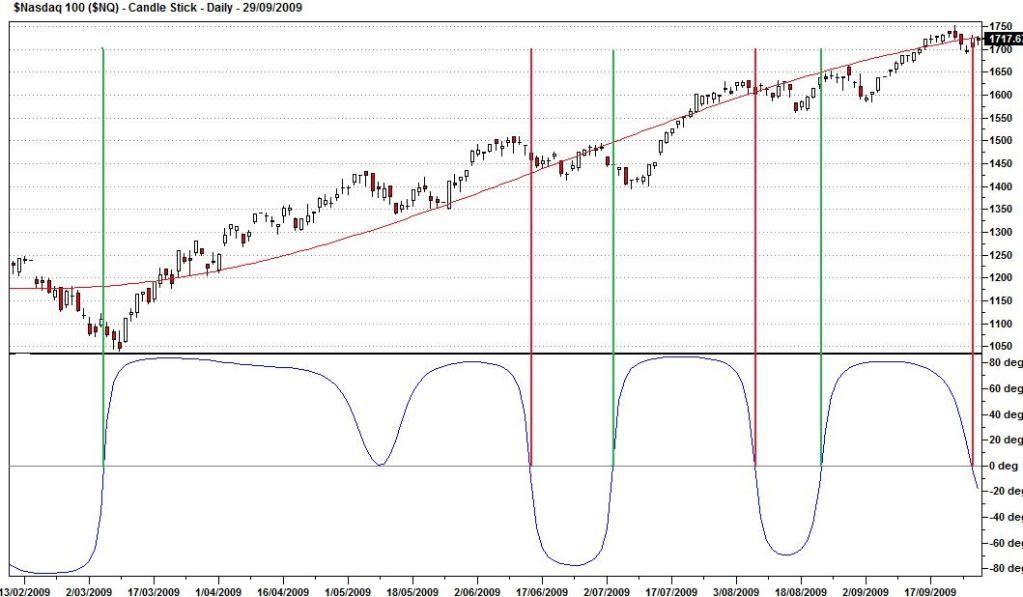
3 Cycle Analysis charts below of US market. The cigar has been snagged!
The following shouldn't be considered investment advice. These charts purely based on prior time cycles, no future predictions.
The chart suggestions below;
* Green = Long
* Red = Short
----------
DJIA - signal has crossed, suggesting possible time to short market.
SP500 - signal has crossed, suggesting possible time to short market.
Nasdaq - signal has crossed, suggesting possible time to short market.
XJO - chart not shown (still no cigar) but today may prove to be the final straw.
----------
I hope these charts are useful, as they take a crazy amount of time to create. I'm heading out into the sunshine - Enjoy :)
Add to My Watchlist
What is My Watchlist?


