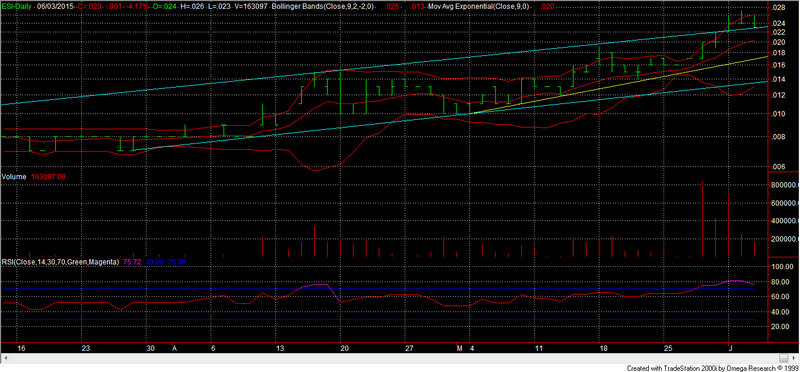
Rsi and stochastic has issued a bearish signal. Bollinger band trix appear overbought. Vroc also adds some bearish pressure to the picture.
The rest seem ok atm. (dmi, adx, 2 & 3 line MA’s, macd…)
2.3 must remain solid if there’s to be a rebound, otherwise a breakdown may see the sp testing the support area between 1.8/2.0 IMO.
(two/sub two! s'il vous plait lol)
Just an opinion anyway, it could be incorrect.. (perhaps)
In the mean time, how about a donation for a hungry buzzard : (
ESI Chart, page-183


Add ECT (ASX) to my watchlist
 (20min delay) (20min delay)
|
|||||
|
Last
0.2¢ |
Change
0.000(0.00%) |
Mkt cap ! $6.343M | |||
| Open | High | Low | Value | Volume |
| 0.0¢ | 0.0¢ | 0.0¢ | $0 | 0 |
Buyers (Bids)
| No. | Vol. | Price($) |
|---|---|---|
| 58 | 31163981 | 0.2¢ |
Sellers (Offers)
| Price($) | Vol. | No. |
|---|---|---|
| 0.3¢ | 11260517 | 26 |
View Market Depth
| Last trade - 14.07pm 18/09/2024 (20 minute delay) ? |
| ECT (ASX) Chart |
Day chart unavailable