Hello.
"Looking at this weekly fib chart is this what you mean by head and shoulders pattern forming"
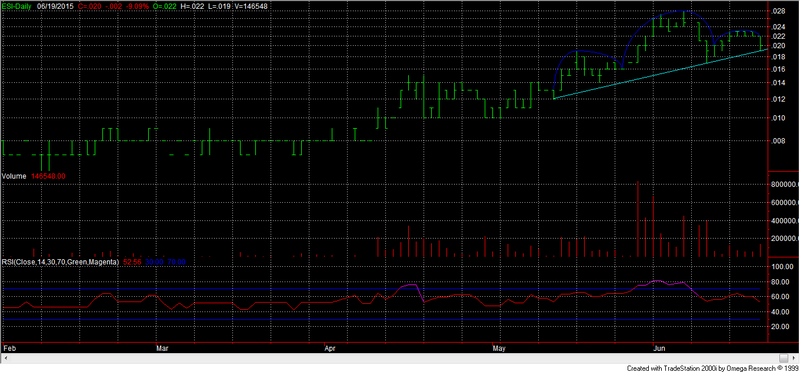
It’s more evident on your previous daily chart Ruselle.
“plus sp range from .018 to .015? R”
Me not a big fan in relying on the sole use of the Fibonacci indicator to punt my hard earned on. But each to their own. (my support levels are derived from a combo of certain chart formations from several periods that coincide & indicator levels)
1.5 is a major level of support, but where she goes nobody really knows : )
Yes that head & shoulders looks complete now, illustrated on the basic chart below anyway.
Rsi issued a bearish signal a few weeks ago while in distribution in the mid 2’s btw. (short term macd, adx, vroc, 2 line MA, parabolic, linear regression, ema & Acc/Dis are also bearish atm)
ESI Chart, page-367


Add ECT (ASX) to my watchlist
 (20min delay) (20min delay)
|
|||||
|
Last
0.3¢ |
Change
0.000(0.00%) |
Mkt cap ! $7.929M | |||
| Open | High | Low | Value | Volume |
| 0.0¢ | 0.0¢ | 0.0¢ | $0 | 0 |
Buyers (Bids)
| No. | Vol. | Price($) |
|---|---|---|
| 46 | 20988336 | 0.2¢ |
Sellers (Offers)
| Price($) | Vol. | No. |
|---|---|---|
| 0.3¢ | 8145583 | 8 |
View Market Depth
| Last trade - 16.12pm 15/08/2024 (20 minute delay) ? |
| ECT (ASX) Chart |
Day chart unavailable