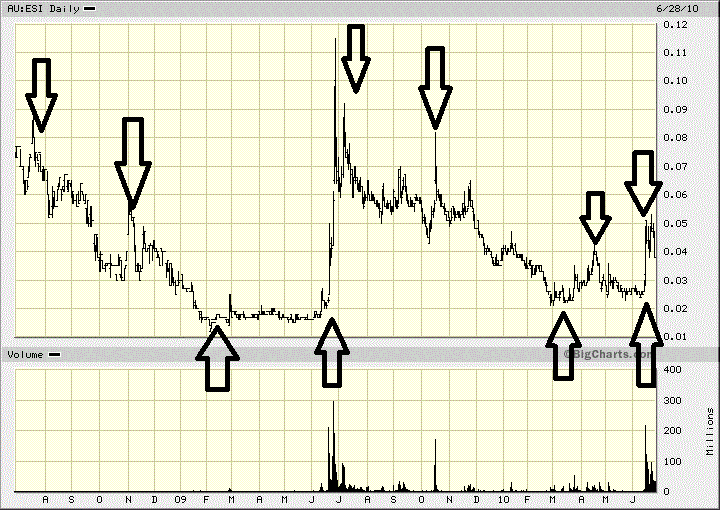
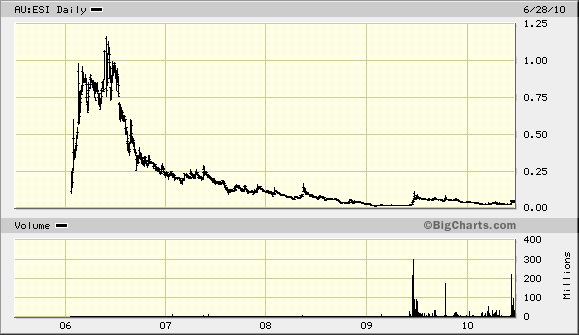
First let me offer you (new holders) this video to watch, and then look at the chart below and you can work out the rest.
http://www.youtube.com/watch?v=cDpPlrHgquM
Secondly the chart,
This is a 1 year chart, then a 5 year chart. I hope you can see a pattern. The up and down arrows signfy the buy and sell points, which i post (when i am in the country).
Now after putting two and two together, I ask you? whom is trying to decieve whom? A trade is a trade is a trade, and this is just a trade.
Their are many companies worldwide who do what ESI claim, just google, lignite, coal drying, whats unique about ESI, is that its on the ASX!!! thats it. They dont even have a feasibility study done!
PS i have buys in at 2.6c now...
Beware the spruikers who promise you the world.
- Forums
- ASX - By Stock
- ECT
- esi pump and dump chart history
ECT
environmental clean technologies limited.
Add to My Watchlist
9.23%
 !
7.1¢
esi pump and dump chart history
-
- There are more pages in this discussion • 8 more messages in this thread...
You’re viewing a single post only. To view the entire thread just sign in or Join Now (FREE)
Featured News
Add to My Watchlist
What is My Watchlist?
A personalised tool to help users track selected stocks. Delivering real-time notifications on price updates, announcements, and performance stats on each to help make informed investment decisions.
 (20min delay) (20min delay)
|
|||||
|
Last
7.1¢ |
Change
0.006(9.23%) |
Mkt cap ! $19.00M | |||
| Open | High | Low | Value | Volume |
| 6.6¢ | 7.1¢ | 6.6¢ | $44.72K | 639.6K |
Buyers (Bids)
| No. | Vol. | Price($) |
|---|---|---|
| 1 | 39299 | 7.0¢ |
Sellers (Offers)
| Price($) | Vol. | No. |
|---|---|---|
| 7.1¢ | 24228 | 2 |
View Market Depth
| No. | Vol. | Price($) |
|---|---|---|
| 1 | 39299 | 0.070 |
| 1 | 100000 | 0.068 |
| 3 | 60000 | 0.067 |
| 1 | 99920 | 0.065 |
| 1 | 100000 | 0.064 |
| Price($) | Vol. | No. |
|---|---|---|
| 0.071 | 24228 | 2 |
| 0.072 | 41000 | 1 |
| 0.074 | 372790 | 1 |
| 0.075 | 294334 | 4 |
| 0.076 | 50001 | 1 |
| Last trade - 16.10pm 17/09/2025 (20 minute delay) ? |
Featured News
| ECT (ASX) Chart |


