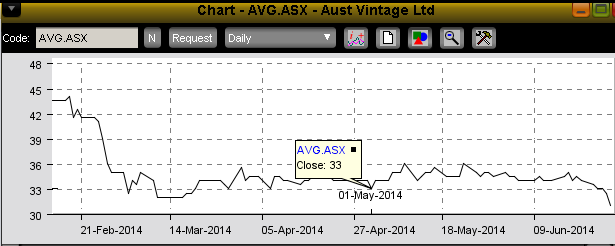
This is an interesting one. They dropped sharply after the half yearly report and then held steady for a few months in the 32-36c range, mostly above 33c. Market response to the 1 May Vintage and Trading Update was muted but positive. Only now have they broken through 32c to trade at 31c, and the daily chart suddenly looks a bit ugly.
Any ideas why?
This is an interesting one. They dropped sharply after the half...


Add AVG (ASX) to my watchlist
 (20min delay) (20min delay)
|
|||||
|
Last
16.5¢ |
Change
0.005(3.13%) |
Mkt cap ! $56.00M | |||
| Open | High | Low | Value | Volume |
| 16.5¢ | 17.3¢ | 16.0¢ | $64.02K | 377.4K |
Buyers (Bids)
| No. | Vol. | Price($) |
|---|---|---|
| 3 | 925579 | 16.5¢ |
Sellers (Offers)
| Price($) | Vol. | No. |
|---|---|---|
| 17.0¢ | 142268 | 6 |
View Market Depth
| Last trade - 15.16pm 11/07/2024 (20 minute delay) ? |
| AVG (ASX) Chart |