OK - Boys & Girls,
From a technical point of view, this does not look good and most would suspect the sell off to continue on Tuesday.
There are a few critical levels on the chart:
The first one is the closest, but not much of a support line @ $3.00 even, most likely could easily be broken.
The next level has a bit more support @ $2.60, nothing of real strength though, which may well be broken as well, however this area coinsides with the 61.8% FIB Retracement level of $2.53, so it may stabilise in this area...!
The entry level and fair value most technical chartists will be looking at is $2.32, which offers the most support of recent times, If this line is penetrated, run for the hills...lol, because it looks like the next station and long term support is @ $1.49.
Good luck all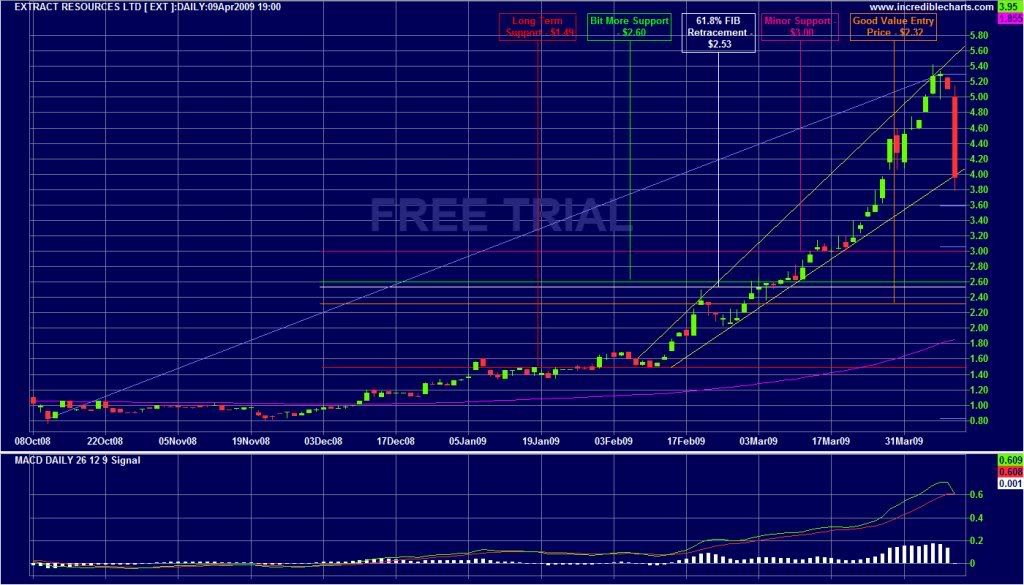
extract resources technical analysis


Add EXT (ASX) to my watchlist
 (20min delay) (20min delay)
|
|||||
|
Last
0.9¢ |
Change
0.000(0.00%) |
Mkt cap ! $11.79M | |||
| Open | High | Low | Value | Volume |
| 0.9¢ | 0.9¢ | 0.8¢ | $10.55K | 1.173M |
Buyers (Bids)
| No. | Vol. | Price($) |
|---|---|---|
| 1 | 14923 | 0.9¢ |
Sellers (Offers)
| Price($) | Vol. | No. |
|---|---|---|
| 1.0¢ | 13427448 | 15 |
View Market Depth
| Last trade - 13.13pm 25/07/2024 (20 minute delay) ? |
| EXT (ASX) Chart |