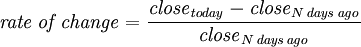
Ok so the link you sent was about Momentum investing. The theory seems to be that you invest in stocks that have already been going up for a period\amount that fits your subjective criteria possibly using a formula like this one (from Wikipedia):
Or this one:
For the sake of this post I'll assume you are using a formula that is similar to this. If you're using a formula that is different let me know as it may counter some of my arguments.
Then you dump the stock when it's going down using similar subjective criteria. Buy high and (hopefully) sell higher.
The idea being that you will be exploiting psychology such as "investor herding, investor over and underreaction, and confirmation bias". Which is to say that if something is consistently going up people sometimes assume that it will keep going up.
The psychology part of this idea does make sense, the problem is whether or not the strategy is going to be successful in identifying and exploiting it. Here's some issues off the top of my head:
* As per my previous post the identification of "momentum" is based on price movements in the past
* While the strategy is called "momentum" the Wikipedia formulas are not analogous to momentum in Physics. Therefore while they indicate that the price has risen they do not indicate or imply that it will continue to rise.

Of the two formulas above the "momentum" formula is really just measuring distance and the "rate of change" formula is similar to (but not the same as) velocity. To measure something similar to P you would need an equivalent to mass... possibly volume might sub in here but that isn't in the Wikipedia formulas.
* The strategy doesn't pick the bottom or the top, so you will always miss out both ways.
your profit = trend - buy threshold - sell threshold
The trend must be strong enough to continue long enough for this to be profitable and the "strength" of the trend is not measured by the triggering formula.
* There is no indication given by this analysis that the trend wont end immediately after you purchase the stock
* If the stock drops immediately after the trend finishes then you may end up being forced to sell lower than your threshold
* By following this approach you would be exhibiting at least one of the psychological factors that you are attempting to exploit
i.e. "investor herding"
Please consider the above constructive criticism of the idea (I'm not having a go at you personally).
If you have counter arguments to any of the above I'd be very interested in hearing them.
Extremely Bullish Chart Patterns, page-201


Add SHJ (ASX) to my watchlist
 (20min delay) (20min delay)
|
|||||
|
Last
74.0¢ |
Change
0.030(4.23%) |
Mkt cap ! $128.2M | |||
| Open | High | Low | Value | Volume |
| 71.0¢ | 74.0¢ | 71.0¢ | $16.81K | 23.63K |
Buyers (Bids)
| No. | Vol. | Price($) |
|---|---|---|
| 1 | 6944 | 72.0¢ |
Sellers (Offers)
| Price($) | Vol. | No. |
|---|---|---|
| 74.0¢ | 1126 | 1 |
View Market Depth
| Last trade - 11.59am 29/08/2024 (20 minute delay) ? |
| SHJ (ASX) Chart |