Hiya Kbear1 - I agree and yup have done so a while back.
Anyhows - I noted there were some very bearish views posted on the weekend charting threads so I thought I would throw up some charts having a look at the same. Charts are charts and somewhere in the chaotic psychology of markets they do capture a glimpse of the probabilty of future price action - all whilst looking backwards. IMO.
There is no doubt that the current trend is down and the price charts look - well - yuk. Having said that though I am seeing some indication of a bottom and the possibility of some sort of change in direction.
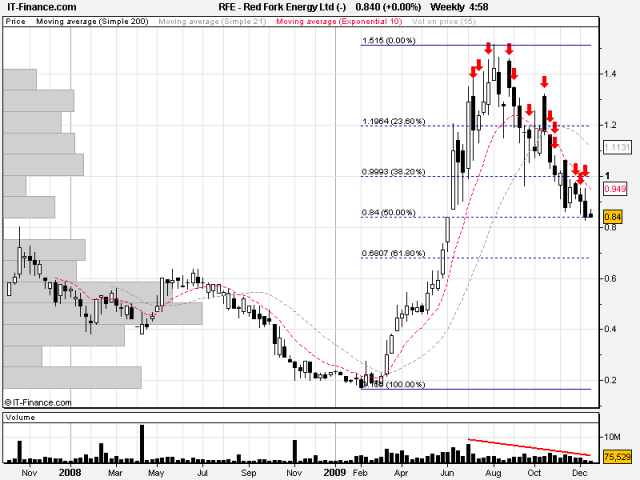
If we checkout the weekly chart there are some observations I would make. Note that on this chart I have taken Wealths announcement observation from the other day and marked the week an announcement was made with a red arrow - just for fun - yay.
On the weekly
- support has been found at the 50% fib retracement line of the entire move. The often discussed gap is filled here.
- volume is significantly decreasing since late October.
- The horizontal bars on the left of the chart is a proportional representation of the number of shares transacted at a given price level (split into 15 equi-envelopes from 16.5c to 151.5c). It is interesting to note there has been bugger all shares traded since late Oct 2007 in the envelope immediately below the 50% fib. Interesting IMO.
- The weekly doesn't look particularly flash.

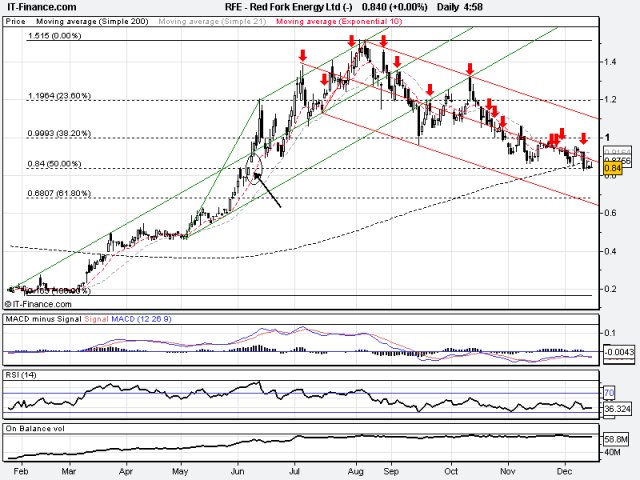
On the daily
- again I have marked Wealths +ve announcement days wit a red arrow on the day of the ann.
- trend is clearly down with support shown at the 50% fib.
- slight divergence detected in MACD, RSI and OBV (see 4 hourly chart following the daily)
- resistance is evident from the downtrend Forks midline.

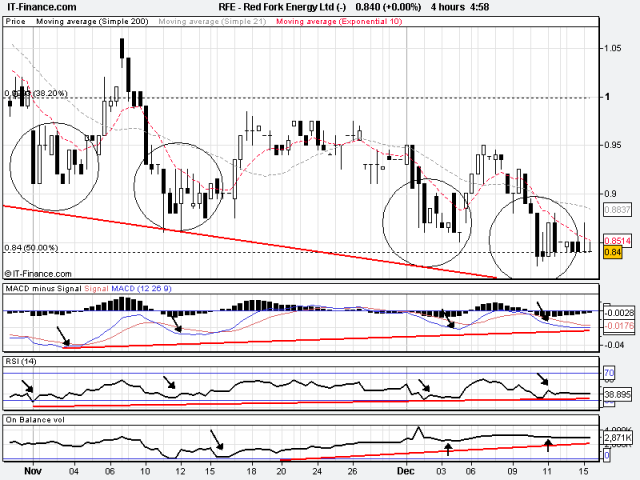
On the 4 hourly
- as all of the above but the divergence mentioned is more evident.
- Since the beginning of Novemeber as the chart has put in lower prices - lower lows - the MACD, RSI and OBV indicators have failed to put in new lows. This divergence is indication that the current trend is exhausting.
- the divergence is more apparent the lower the timeframe so 1 hrly etc.

Whats it all mean. Well I reckon in all probability that due to the price/indicator divergence - the significant drying up of volume and the support at the 50% fib line that the current downtrend is nearing exhaustion and we are about to move to something that will make us happier - maybe something around $1.10 sometime in the not to distant.
Or maybe not :) At the moment I haven't discounted a total breakdown to the 61.8% retracement although the probability of this decreases the longer that price and indicators diverge.
Anyway - squigglylines and mumbo jumbo perhaps - the market will determine price. I just want em to drill baby drill - at the moment our 1P reserves based on todays announced Exxon bizo values us at $70 odd mill I calculated. If we prove up our 2P stuff - price would exceed RFE's high by a considerable amount. Given todays number it just puts a different slant on valuation.
Cheers


