Robbbb put an interesting video up on the XJO thread the other day about how he uses fibs to determine strength or weakness in a stock. When I watched it I immediately thought of RXL. IMO RXL is only marking time as the chart indicators catch up with the last big run up. I have looked at a lot of charts in my time and stocks just don't run away and keep running. Either price retreats to restore equilibrium with the chart indicators or, as seems so far to be the case with RXL, the stock must mark time until the chart indicators catch up. Note how RXL has found some support with the bolinger band centre line....it got a lift from that level on Friday albeit on light volume. The volume was massive when the stock spiked but has been puny on the retrace...another sign of strength IMO. The stochastics have come off from overbought and the 50 and 200 day SMAs (not shown on chart) crossed on friday....all good signs.
Using Robbbbs ideas about repeating ranges the next target should be around 7c.....that augers particularly well for the RXLOA options and that may explain why they didn't budge during a very ordinary week for the markets generally.
http://www.youtube.com/user/TradeTheTrade#p/u/6/TQquaMn-vK0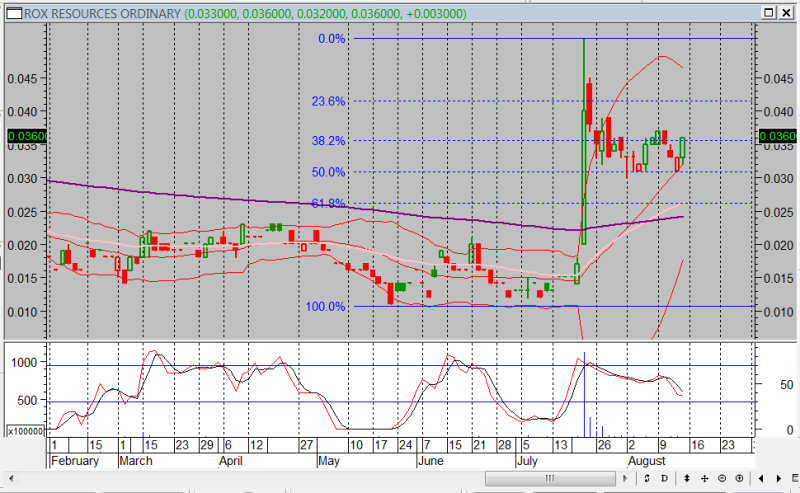
fair value, page-6


Add RXL (ASX) to my watchlist
 (20min delay) (20min delay)
|
|||||
|
Last
14.0¢ |
Change
0.000(0.00%) |
Mkt cap ! $57.30M | |||
| Open | High | Low | Value | Volume |
| 14.0¢ | 14.0¢ | 13.5¢ | $250.6K | 1.792M |
Buyers (Bids)
| No. | Vol. | Price($) |
|---|---|---|
| 1 | 100000 | 13.5¢ |
Sellers (Offers)
| Price($) | Vol. | No. |
|---|---|---|
| 14.0¢ | 211428 | 2 |
View Market Depth
| Last trade - 16.10pm 13/09/2024 (20 minute delay) ? |
| RXL (ASX) Chart |