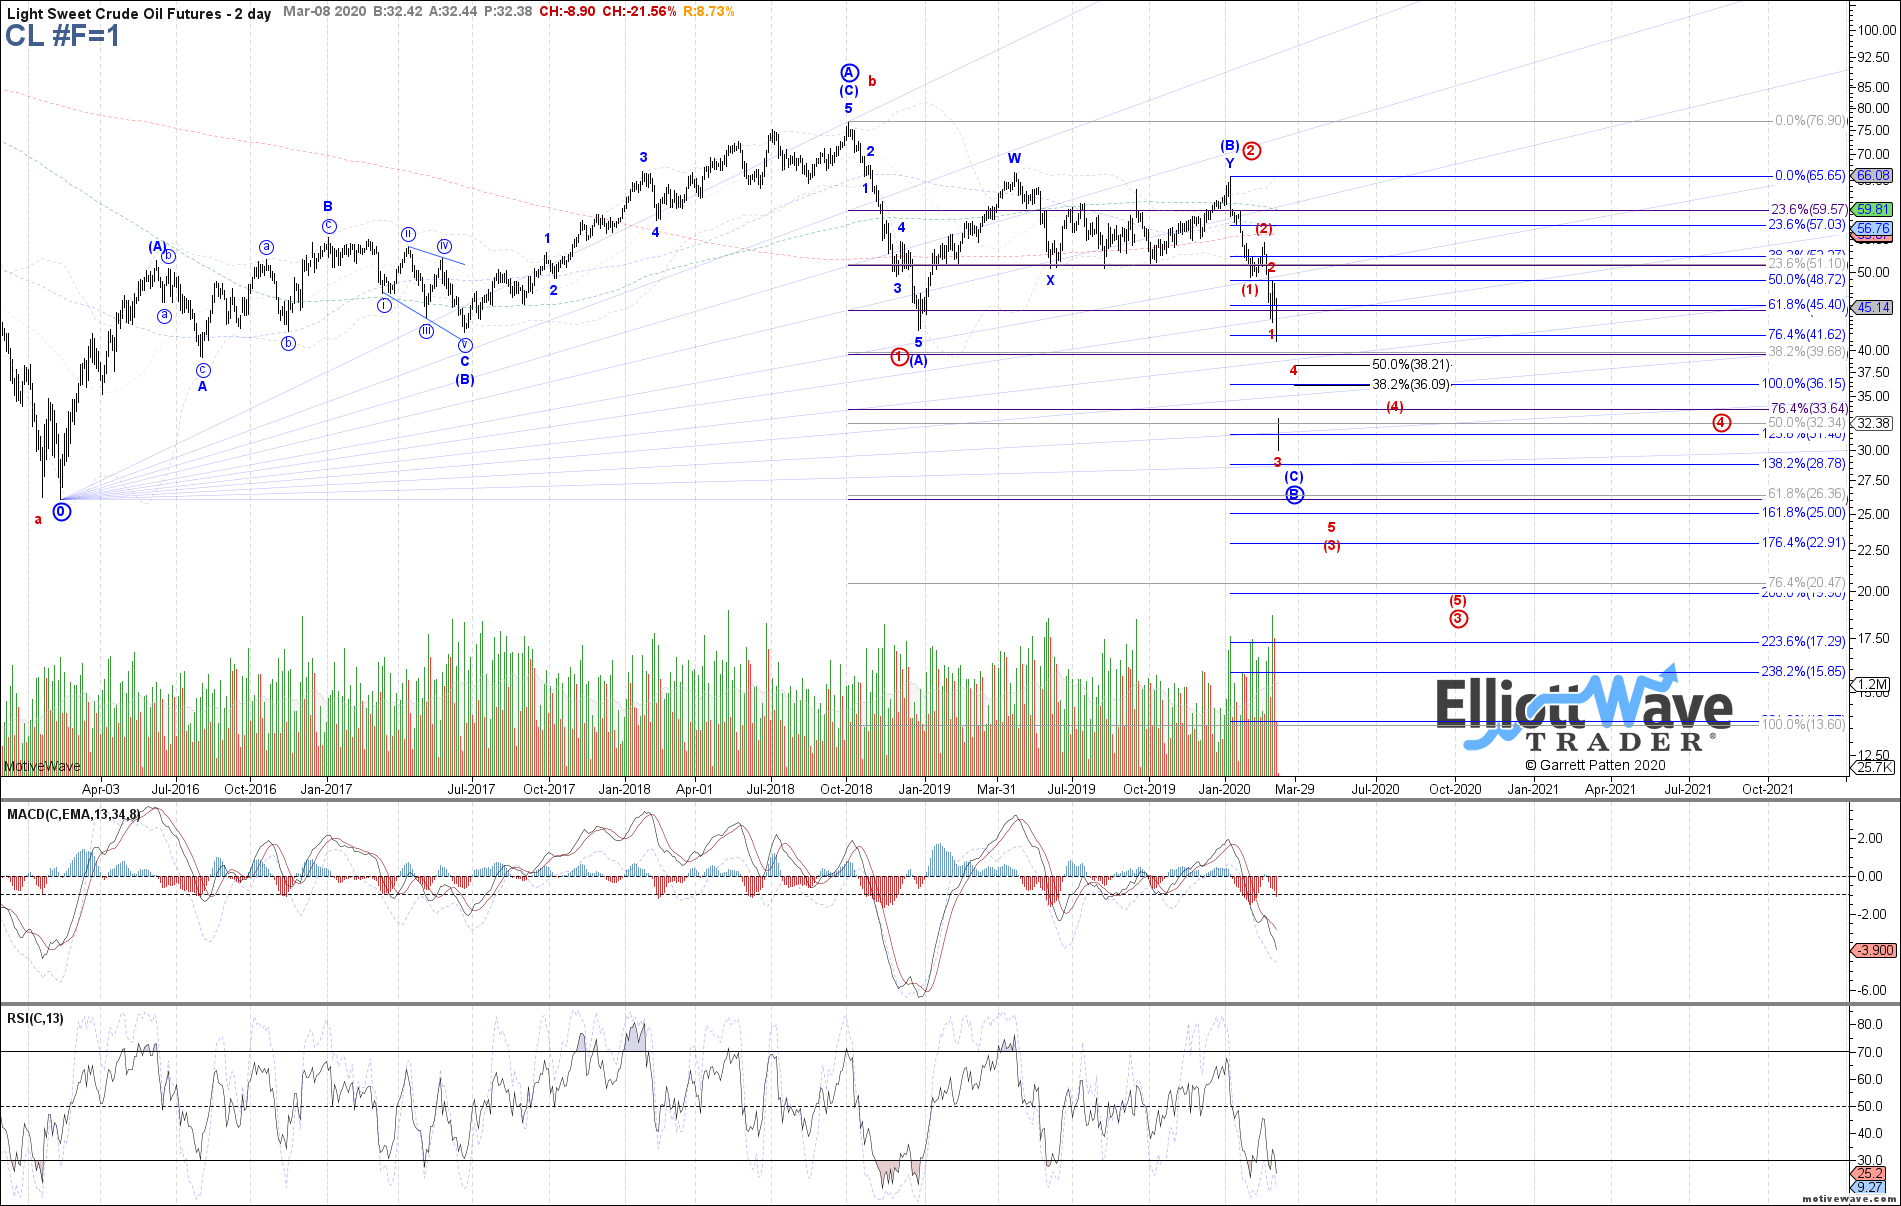
For those interested in charting there are two Elliott Wave counts currently being charted by analysts. Link to chart below. The more short term bearish count has Oil futures (CL) hitting $20 and possibly lower but the more bullish count has oil hitting $27 area in a B wave correction which has subsequently been hit and the subsequent C wave which is not shown on this chart could take oil back to and possibly exceed previous A wave high ($76.90).
There is a gap in the chart to be filled at $41 area. Gaps in my view are important. Break above them and they become good support but will act as resistance until the breakout occurs meaning an increased risk of lower prices. FAR has two gaps to watch. 2.6c & 5.4c. These gaps will act as resistance until such time the price trades above them. Shorters will be looking to short at gaps.
If CL can rally above the $41 gap then this gap will act as a floor (Support). If CL cannot strongly close above this gap then it will act as a ceiling (resistance) and thus CL is at risk of the more bearish chart count down to $20 increasing as a possibility. Putting my optimist hat on I suspect CL will rally but be unable to break above $41 and need some time trading between $27 - $41 to build up momentum required to break out. IF CL takes out the $27 low then the bearish count becomes a higher probability outcome. CL is currently trading at $34.
https://www.elliottwavetrader.net/images/charts/202003/full-282d6e46108c2fa17d88dd7c4cef9a7b29b42d7d.png
FAR and the future, page-56


Add FAR (ASX) to my watchlist
 (20min delay) (20min delay)
|
|||||
|
Last
48.0¢ |
Change
0.000(0.00%) |
Mkt cap ! $44.35M | |||
| Open | High | Low | Value | Volume |
| 0.0¢ | 0.0¢ | 0.0¢ | $0 | 0 |
Buyers (Bids)
| No. | Vol. | Price($) |
|---|---|---|
| 2 | 79066 | 48.0¢ |
Sellers (Offers)
| Price($) | Vol. | No. |
|---|---|---|
| 48.5¢ | 9050 | 1 |
View Market Depth
| Last trade - 16.12pm 08/08/2024 (20 minute delay) ? |
| FAR (ASX) Chart |
Day chart unavailable