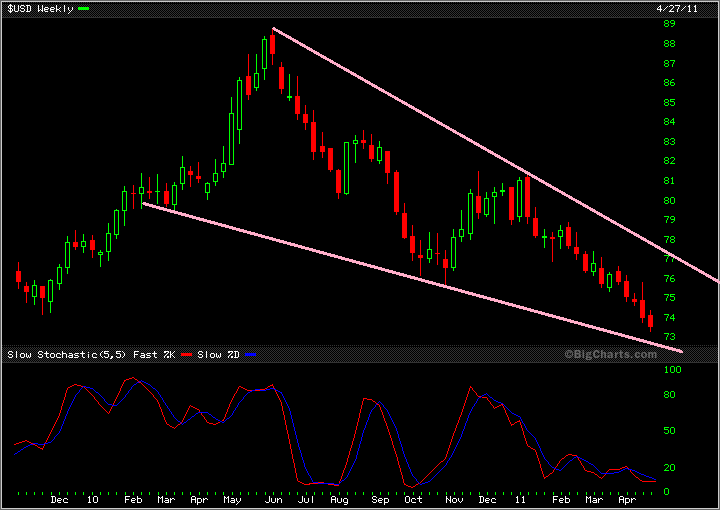
Maybe we could interpret the USD chart below as a falling wedge. When the USD hits the wedge bottom it could mean a multi week rally for the USD which in turn could mean a multi week correction for the US market. That should happen next week and would certainly give some creedence to the old saying "Go away in May"......
- Forums
- ASX - By Stock
- XJO
- feel the love friday
feel the love friday, page-12
Featured News
Add XJO (ASX) to my watchlist
 (20min delay) (20min delay)
|
|||||
|
Last
8,266.2 |
Change
-28.900(0.35%) |
Mkt cap ! n/a | |||
| Open | High | Low |
| 8,295.1 | 8,295.1 | 8,246.7 |
Featured News
| XJO (ASX) Chart |
The Watchlist
I88
INFINI RESOURCES LIMITED
Charles Armstrong, MD & CEO
Charles Armstrong
MD & CEO
Previous Video
Next Video
SPONSORED BY The Market Online


