Maybe we could interpret the USD chart below as a falling wedge. When the USD hits the wedge bottom it could mean a multi week rally for the USD which in turn could mean a multi week correction for the US market. That should happen next week and would certainly give some creedence to the old saying "Go away in May"......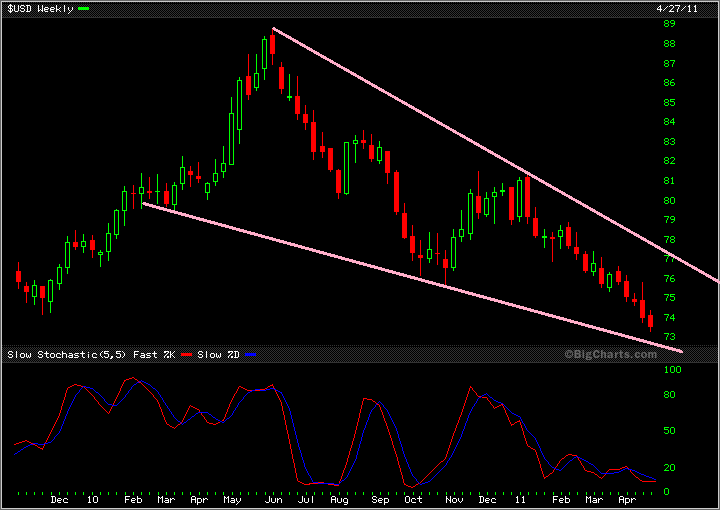
Maybe we could interpret the USD chart below as a falling wedge....


Add XJO (ASX) to my watchlist
 (20min delay) (20min delay)
|
|||||
|
Last
7,953.2 |
Change
-36.400(0.46%) |
Mkt cap ! n/a | |||
| Open | High | Low |
| 7,989.6 | 7,989.6 | 7,894.3 |
| XJO (ASX) Chart |