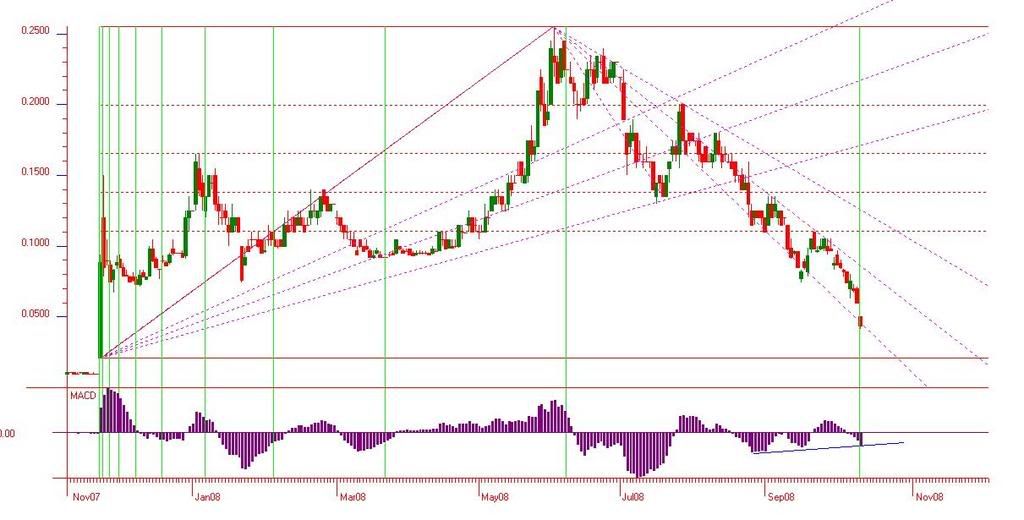
Nana, have a look over this chart and let me know what you think. The whole thing is based on fib ratios (time series in green, fans in purple and retracement in red).
Note that with one exception on the 5th Feb, the time series expansion has accurately predicted the points of inflection for the stock. Similarly, the stock has tended to find support and resistance at the fib retracement levels, and has trended within the fan lines.
The current fan channel (bounded by the 38.2% and 50% lines) has been tested repeatedly since late July. With the time series now predicting another price inversion, and the share price directly on the lower boundary of the fan channel, would this be a decent time to anticipate a rally? Note the stock has moved into oversold status (RSI) for the first time since the move away from 1c.
The downside risk of failure of the 38.2% line would be a 2.2c (50%) drop to find support at the 100% retracement level, so it is not necessarily a trade I will be chasing, though am interested in hearing your method of prediction for trading over the next two or three days.
Your thoughts?
Cheers
- Forums
- ASX - By Stock
- fib works well
Nana, have a look over this chart and let me know what you...
Featured News
Add RHK (ASX) to my watchlist
 (20min delay) (20min delay)
|
|||||
|
Last
72.0¢ |
Change
0.030(4.35%) |
Mkt cap ! $143.8M | |||
| Open | High | Low | Value | Volume |
| 72.5¢ | 72.5¢ | 72.0¢ | $7.054K | 9.79K |
Buyers (Bids)
| No. | Vol. | Price($) |
|---|---|---|
| 1 | 25 | 69.0¢ |
Sellers (Offers)
| Price($) | Vol. | No. |
|---|---|---|
| 83.0¢ | 2276 | 1 |
View Market Depth
| No. | Vol. | Price($) |
|---|---|---|
| 1 | 25 | 0.690 |
| 1 | 1000 | 0.680 |
| 1 | 2000 | 0.650 |
| 1 | 10000 | 0.630 |
| 1 | 20000 | 0.500 |
| Price($) | Vol. | No. |
|---|---|---|
| 0.835 | 5942 | 1 |
| 0.840 | 13496 | 3 |
| 0.845 | 14500 | 1 |
| 0.860 | 47991 | 2 |
| 0.890 | 22368 | 2 |
| Last trade - 15.50pm 08/11/2024 (20 minute delay) ? |
Featured News
| RHK (ASX) Chart |
The Watchlist
EQN
EQUINOX RESOURCES LIMITED.
Zac Komur, MD & CEO
Zac Komur
MD & CEO
SPONSORED BY The Market Online


