Hey Rob. Thanks for the info and chart! your definantly my favorite poster here, Ive been looking at all your charts with great interest (even if a few of them are really complicated).
Ahh I see, so you just used the bottom points and extended the line, and used Fibonacci stuff (Im looking into that now too!) to find where the possible bottom could be.
Ill check that out aswell, i use Hubb investor, it was a free download, so you use that too?
Mark10: ahh ok, I get what you meant. I wasn't exactly predicting it would reach a dollar, more saying if it DID, it would be a good sign.
Haspete: Those links look great, thanks. Ill check them out tonight :)
I redid my graph, looks like its right on the line now. If it opens green tomorrow, i think I might buy back in after selling off at 1.10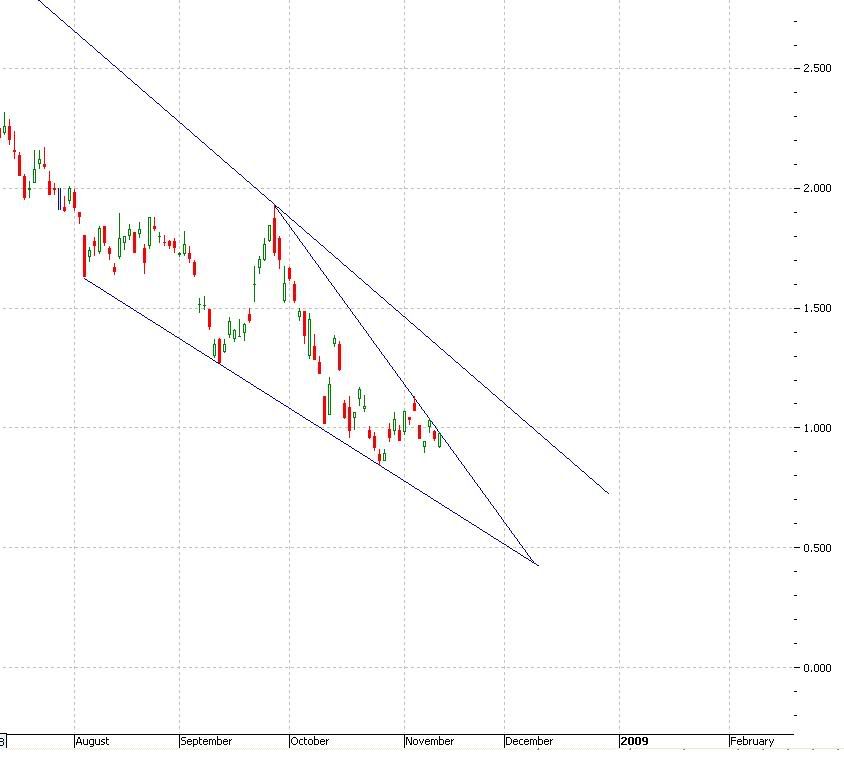
first attempt at charting, page-24
-
-
- There are more pages in this discussion • 1 more message in this thread...


You’re viewing a single post only. To view the entire thread just sign in or Join Now (FREE)