i am becoming a bit interested in whyme's ultimate low for Jan 19.
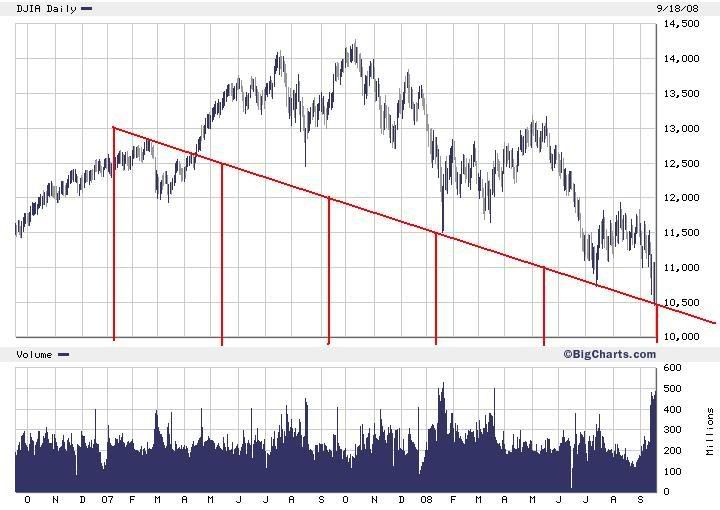
the line that the dow bounced off this week goes back to the be resistance for the march 2007 correction and support for jan and july lows. that line is falling at a rate, give or take, about 125 points/month. So by Jan 19 the line will be around the 10,000ish mark give or take.
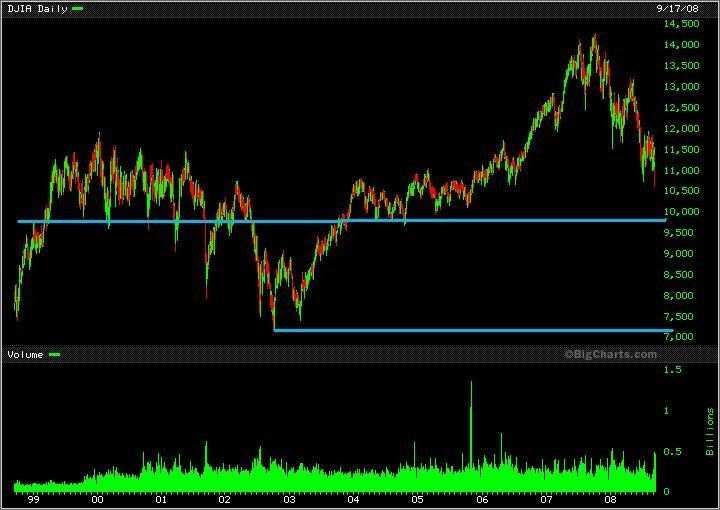
there is enormous chart support around 9,900
1. it represents 61.8% of the entire bull
2. draw a horizontal line back from today to 2000 to see the 9900 support
3. draw a diagonal line from the 1995 breakout and we are around the same area.
I admit I'm not so strong on the cycle thing yet so I don't know how whyme got that date but it sure does seem to be supported by projected price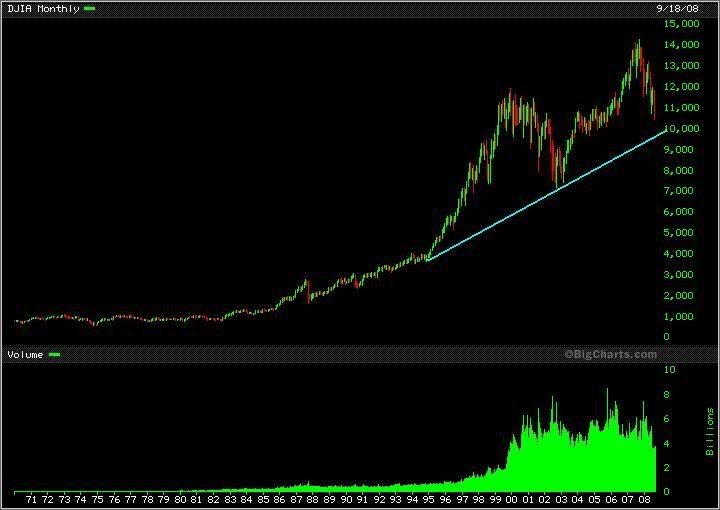
for pingu219, page-74


Add XJO (ASX) to my watchlist
 (20min delay) (20min delay)
|
|||||
|
Last
7,850.7 |
Change
23.900(0.31%) |
Mkt cap ! n/a | |||
| Open | High | Low |
| 7,826.8 | 7,910.2 | 7,826.8 |
| XJO (ASX) Chart |