http://www.appinsys.com/GlobalWarming/SixtyYearCycle.htm
Cycles are apparent in climate data. This document examines the appearance of the approximately 60-year cycle that shows up in many areas. This cycle length is not exactly 60 years and varies by a few years between various climatic phenomena and locations.
Climate models do not account for this cycle.
[update 2012/01/09: Solar System section expanded]
[update 2011/03/03: ITCZ section added, other sections expanded]
[update 2011/01/01: “Morelet Wavelet” added to Global Temperature section, other sections expanded]
[update 2010/06/05: “El Nino” section added]
[update 2010/06/04: “Solar System Influence” section added]
[original document: 2010/02/21]
Solar System Influence
Nicola Scafetta has identified the change in the location of the center of mass of the solar system (CMSS) as a possible mechanism driving the 60-year cycle. (Scafetta, N., “Empirical evidence for a celestial origin of the climate oscillations and its implications”, Journal of Atmospheric and Solar-Terrestrial Physics (2010), doi:10.1016/j.jastp.2010.04.015 [http://arxiv.org/PS_cache/arxiv/pdf/1005/1005.4639v1.pdf])
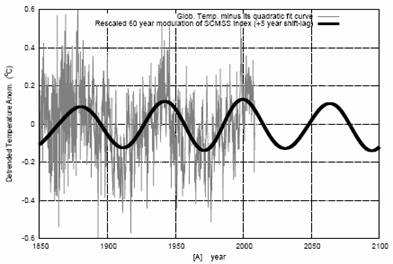
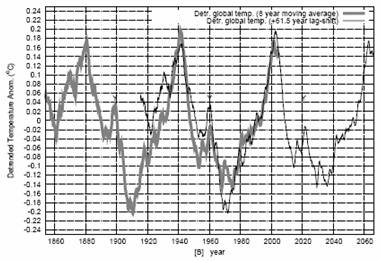
Scafetta shows the following figures described as: “[A- (left)] Rescaled SCMSS 60 year cycle (black curve) against the global surface temperature record (grey) detrended of its quadratic fit; [B- (right)] Eight year moving average of the global temperature detrended of its quadratic fit and plotted against itself shifted by 61.5 years. Note the perfect correspondence between the 1880-1940 and 1940-2000 periods. Also a smaller cycle, whose peaks are indicated by the letter “Y”, is clearly visible in the two records. This smaller cycle is mostly related to the 30-year modulation of the temperature. These results reveal the natural origin of a large 60-year modulation in the temperature records.” (SCMSS – Speed of the CMSS)
The following figure shows the speed of the Sun relative to the CMSS showing “20 and 60 year oscillations”. (From the Scafetta paper referenced above.) It shows a 60-year cycle with peaks similar to the global average temperatures shown at the start of this document – around 1880, 1940 and 2000.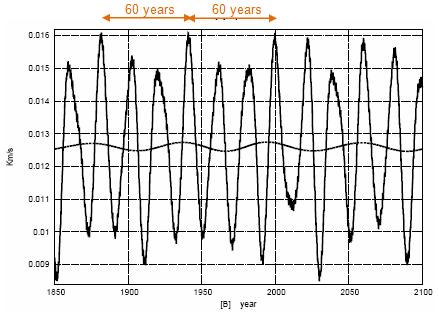
for resource -warning very long post, page-5


Featured News
Featured News
The Watchlist
VMM
VIRIDIS MINING AND MINERALS LIMITED
Rafael Moreno, CEO
Rafael Moreno
CEO
SPONSORED BY The Market Online