Hi VBA fans,
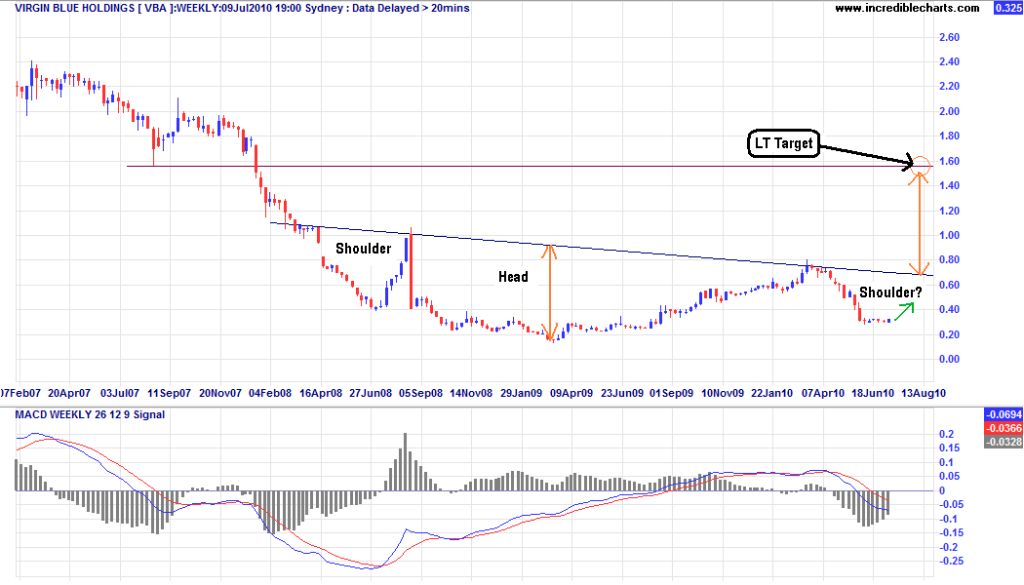
Posting a longer term historical chart here illustrating the share price potential for the not-so-distant future. Currently, we have what looks to be unfolding an inverted head-and-shoulders pattern, which we all know is quite a bullish pattern indeed.
By measuring the depth of the 'head' portion of the pattern (the first orange line with dual arrows), we can then re-project that distance starting at the point where we believe we have closure of a second shoulder (second orange arrow). In this case, the projected distance (or target) looks to be somewhere around the $1.58 mark. If we go back in time, we can see this point also coincides with a longer term support line, which in our case becomes our potential share price resistance point.
Note too, the MACD histogram is contracting, thus suggesting an upswing is potentially eminent. I haven't shown the volume below, but we had quite a substantial spike in volume on Friday (near 50M) along with the start of upward movement - certainly a good start point for a run up.
Good luck trading.
cheers
S
ps. The above are my humble opinions only, so any comments are welcome.

Add to My Watchlist
What is My Watchlist?


